|
|
Revision History (Archives, 2010)
30 December 2010
Version 2.3.0.5
- Added options for image export. For GIF and PNG images, you can
now specify that the plot background color should be transparent. (Whether the target application respects the transparency setting is outside
DPlot's control. Google Earth, for one, does honor this setting.) For both GIF and PNG images, antialiasing is forced off and the standard Windows'
font antialiasing is turned off. You may get better results saving to 32-bit PNG, particularly when importing images into Google Earth.
Updated the SetPluginImageDims macro/DDE command to take
account of this new capability.
Note: Whether output is to an 8-bit GIF or 32-bit PNG, all antialiasing (including text) will be turned off. Depending on your needs and
what is possible, you can produce a better-looking image by saving the background image, cropped to the appropriate extents, and importing that
background image into DPlot rather than going the other way: saving a transparent image in DPlot and importing that image into some other application.
In the former case, all DPlot graphics are drawn onto a background image that is already in place, so antialiasing is not an issue: if antialiasing
is turned on or you use one of the Windows default antialiasing features for text, those lines/symbols/text will be drawn as expected, with the
proper antialiasing. See, for example, the Background Images topic in the blog.
- Modified the behavior of tick marks on 2D views of 3D data. If both the X and Y axis
number formats are set to "None" and
a plot has no X,Y,Z Labels, then tick marks are not drawn.
- Bug fix: It was possible to cause DPlot to crash if you used the incorrect number of arguments to a
text placeholder (e.g. $X) in an equation.
14 December 2010
Version 2.3.0.4
- Bug fix: The "Swap X,Y" command on the Edit menu was inadvertently omitted for 4D surface plots, and did not work for 4D scatter plots.
- Bug fix: If you dragged a corner of a 2D plot using the mouse to resize the graph and inverted either the width or height (e.g. dragged the left corner right past the
right corner), DPlot would enter an endless loop attempting to draw the plot within a box with a negative dimension.
- Bug fix: Corrected a problem that might have caused a crash with 2D views of 3D data on a rectangular grid. If "Show coordinates in popup window when mouse
hovers over data point" was checked, DPlot sometimes crashed when working with large data sets due to a division by 0 problem.
21 November 2010
Version 2.3.0.3
- Notes are now saved to and restored from
preference files.
- If you used a non-standard cursor for the "Normal Select" pointer, toolbar tooltips might have been obscured by the cursor in all previous versions.
- Toolbar tooltips now use the same font used in your menus. On Vista and Windows 7 this should make the tooltips a bit easier to read.
- Bug fix: A change to the plugin interface several releases ago that was intended to clean up unused curves in XY plots was inadvertently applied to all data types. As a result
the "Bitmap to 3D" plugin did not display a plot until after you performed some action to edit the data.
- Bug fix: Version 2.3.0.2 included a bug which caused the plot background color to be drawn incorrectly for 3D views of points on a rectangular grid.
13 November 2010
Version 2.3.0.2
- The $AREA text shortcut now works with 3D and 4D surface plots, reporting the plot's surface
area. The resulting text will use the number formatting of the Z axis.
- Added the ability to draw the legend for 3D and 4D surface plots on various sides of the plot. Previous versions forced the location to the right side. Currently these options are
only available via the right-click menu for the legend and are not supported for scatter plots. The ContourLegend command can be used to set the legend placement.
- Added an option for 3D views to display a graphic of the X,Y,Z coordinate axes in the lower left corner of the plot. Currently this option is only available via right-click menu
(Orientation Key). NOTE: No effort is made to include this graphic in the clipped region of saved bitmap images or bitmaps/metafiles copied to the clipboard. In other words
it might be there; it might not. And it might be cropped. This will likely change in a future release. Like the 3D legend options above, this option is only offered via right-click menu in a
quasi-effort to hide it until all the kinks are worked out: it is possible that with this version and using both options that you'll end up with plot attributes overlapping.
- Added "Monthly Peak" plugin for the licensed version, which is handy for finding the monthly peak value within a time series (daily cumulative sales figures, for
example).
- Bug fix: Probability scale with small or large probabilities (less than 0.0001% or greater than 99.9999%) might have resulted in an endless loop.
29 October 2010
Version 2.3.0.1
- Bug fix: Another one introduced with version 2.2.9.9 - calendar dates w/ times in text boxes were not interpreted correctly.
28 October 2010
Version 2.3.0.0
- Bug fix: Version 2.2.9.9 introduced a bug that broke the keyboard shortcuts for changing the view angles of a 3D plot.
26 October 2010
Version 2.2.9.9
- Added "Time of day (fractional days)" number format. The standard
"Time of day (hours)" format assumes values are in hours (0=midnight, 1=1AM, etc.). "Time of day (fractional days)" takes input values in fractional
days (0 again=midnight,0.125=3AM,0.5=noon, etc.). Other than the obvious (your input times are in fractional days), this is mostly beneficial when swapping data to/from
Excel. (Excel always stores times as fractional days, which ended up causing unpredictable problems in many cases with DPlot.) The Add-In
now uses the new "Time of day (fractional days)" format for time values. Please note: This new format will be used in lieu of "Time of day (hours)"
when reading times from a text file, pasting data from clipboard text, or sending data to DPlot from Excel via the Add-In. Generally this will not be a problem.
It may be a problem, though, if you typically modify the X axis values using Operate on X
or similar operation, expecting the X axis values to be stored using whole number hours. You can easily check which format is used by right-clicking on any number
along the X axis.
- Changed dataTaker file import plugin to display all error values (overrange, underrange, etc.) as symbols.
Previous versions ignored those values. Also made a simple change to DPlot that erases curves with 0 points on return from a file import plugin, which might occur
for any number of reasons. And a bug fix: Corrected a few problems in the dataTaker plugin module that might have resulted in crashes for odd files.
- Bug fix: If you opened a file and launched DPlot by double-clicking in Explorer and that file is handled by a file import plugin, DPlot might have
attempted to use the last-used file import plugin rather than the appropriate one to process that file.
- Bug fix: Eliminated the bivariate interpolation method from the Generate Mesh command
for 3D data because it was just too unstable, crashing DPlot in many circumstances. The quadratic interpolation method added with version 2.2.9.1 is completely
stable, quite a bit faster, and produces comparable results.
7 October 2010
Version 2.2.9.8
- Bug fix: The document window list was shown on the View menu for 4D plots rather than the correct Window menu.
- Bug fix: The Define Boundary command did not work with 4D data (only 3D).
4 October 2010
Version 2.2.9.7
- The Month number format will now use the full spelling of the
month, e.g. "January" rather than "Jan", if the date format includes "MMMM".
- The $AREA text placeholder may now include a range in X between
which the area is calculated, similar to how the $YMIN, $YMAX, etc. shortcuts work.
- Added character-formatting buttons to the X,Y(,Z) Labels feature.
- Added "Open" and "Save as" buttons to the Y=f(X),
X=f(T), Y=g(T), and
Y=f(X,Y1,Y2,...) command screens. This might be handy if you have an
operation that you frequently use and you use this command often enough that a particular operation migrates out of the most-recently-used
list (where applicable).
- Added a "Click to zoom" option to the General Options screen.
If checked, you can zoom on 2D plots by clicking and dragging your mouse (without first clicking the Zoom toolbar button). If unchecked,
DPlot behaves as before: clicking and dragging pans the plot. Whether checked or not, the keyboard arrow keys may still be used to pan.
- For USDA Soil Classifications on triangle plots, changed
"Silty Loam" to "Silt Loam" in accordance with the USDA's documentation.
- Bug fix: The "Stacked points are..." note in the lower right corner of a dot graph might have overlapped the numbers along
the horizontal axis when copying or saving the plot to a metafile format.
- Bug fix: Using the Edit Data command on a curve associated with the second (right) Y axis, mouse clicks were scaled to the left axis
rather than the right.
- Bug fix: One more fix for bar charts similar to that made with version 2.2.9.5. If "Unique colors for each bar"
was checked then the same problem with outline pen widths for all but the first bar and non-hollow bars existed.
- Bug fix: Point labels using $X, $Y, or $Z shortcuts immediately
followed by a non-space character (as in $Ykg) did not work properly.
- Bug fix: Error bars on horizontal bar charts were not drawn properly.
- Bug fix: When interpreting text files, if the heading lines contained commas, semicolons, or tabs but the data columns were separated by spaces,
DPlot would erroneously interpret the first data line as a heading and (usually) use that line as the legend.
- Bug fix: Previous versions correctly handled date and time values in the first two columns of text files when the date and time were not
delineated with quotation marks or when the date and time group in total was delineated with quotation marks, whether there was an
intervening comma or not. But DPlot did not correctly combine a date and time when both groups were individually delineated with
quotation marks, as in "10/3/2010","6:45:00 PM". This version correctly handles that combination.
11 September 2010
Version 2.2.9.6
- Added menu options and corresponding toolbar buttons for XY plots to draw grid lines in the horizontal or vertical direction only.
Modified the GridLines macro command to
take account of this new capability.
- Bug fix: If you used "Calendar Date" or "Date and Time" number formats on the X axis with a 3D view of 3D/4D data,
DPlot might have entered an endless loop while drawing the X axis grid lines and labels. Thanks, Scott Englander, for the assist in
tracking this down.
- Bug fix: The Normalize command on the Edit menu erroneously demanded that the input curve(s) be sorted in increasing X order. Since the
operation is independent of X, sort order is irrelevant.
- Bug fix: The Normalize command might not have used the correct minimum and maximum Y values if the plot was produced by a series of calls
to the DPLOTLIB function DPlot_AddData in which the min/max values were
intentionally not found due to a previous call to the DPLOTLIB function
DeferMinMaxCheck.
- Bug fix: With a dependent second Y axis on XY plots, DPlot might have allowed too much space on the right side of the plot when figuring
out the correct placement of the 2nd Y axis label.
- Bug fix: Under some circumstances the "Use N/S/E/W suffix" option for number formatting might have displayed E for N, W for S on
3D surface plots.
27 August, 2010
Version 2.2.9.5
- Added "Outline symbols in black" to the Symbol Styles dialog for 3D scatter plots. In previous versions this setting
was turned on by default and not optional.
- Relaxed the constraints on determining whether all labels would fit along the Y axis. In previous versions DPlot might have skipped over
labels when it wasn't strictly necessary to do so.
- The coefficient boxes on the Multiple Axes dialog can now accept
equations, e.g. "pi/180"
- The Equal Intervals command on the Edit menu now allows you to specify
a start and stop X value, which might be handy if you want the generated curve to start at some "nice" multiple of the interval.
Modified the EditEqualInts command to take into
account this new capability.
- For 3D scatter plots you may now set the line color drawn between points equal to the color of the first endpoint; in all previous
versions the color was forced to black.
- Relaxed constraints that prevented DPlot from handling mouse movement messages (displaying coordinates in the status bar,
for example) while a DDE conversation was active. This check was done to prevent hogging the processor while another application was attempting
to send data to DPlot at a rapid rate. But many legacy applications establish a conversation with DPlot and do not disconnect until the
application is terminated. In this release the check is not against a conversation being active, but against adding data via a call to
DPlot_AddData. After calling DPlot_AddData DPlot behaves as before: mouse movement messages are ignored until the conversation is terminated.
- Bug fix: The lines used for the outline of bars in a bar chart have been fouled up for all but the first bar since the capability of adding
error bars was added to DPlot. This might not have been noticeable for thin lines and/or solid fills.
- Bug fix: Note placement was fouled up for vertical orientation and either center or
right justification.
July 28, 2010
Version 2.2.9.4
- Bug fix: A recent change correcting the calculation of the plot size plus axis labels for triangle plots ended up fouling up this calculation
for all other plot types, such that axis labels were clipped. The problem was likely not noticeable if you sized the plot with
Options>Extents/Intervals/Size, but was quite noticeable if the plot occupied most of the document window. Thanks to
Richard Swaim for pointing out the problem.
July 17, 2010
Version 2.2.9.3
- Added "Half-tone" and "Invert" buttons for "User-defined" fill patterns on the
"Fill Between Curves" dialog box.
- Added dot and double-dot accent format controls for all text entries.
- Amended the dataTaker .DBD file import plugin to correctly handle the new dataTaker
option of saving multiple data sets to the same file.
- Legend location and alignment for XY plots are now saved to preference files.
- Bug fix: Minor tick mark intervals less than 1/2 month on a date scale might have resulted in an endless loop. Also changed how minor tick
mark intervals less than 10 days are handled: in this version the minor tick marks will be drawn at whatever interval exactly divides the
interval to the next major (labeled) tick mark by the number of minor intervals, with no consideration given to drawing minor intervals at
whole days.
- Bug fix: Macro editor misbehaved with Directory or
ForFilesIn commands in which the path contained a closing
parenthesis.
- Bug fix: Triangle plots might have crashed due to an uninitialized data problem if "Specify size" was checked.
July 1, 2010
Version 2.2.9.2
- Y=f(X,Y1,Y2,...) now allows you to specify a curve from which all X values will be taken. In previous versions the output
curve would always have evenly-spaced points between the from X and to X values. Added FXY1Y2_XFrom
macro/DDE command to take account of this new capability. Developers please note: This setting is persistent and might effect the
behavior of the AddCurves, Compare, DivideCurves, FunctionOfXY1Y2, Lump, MultiplyCurves, and SubtractCurves commands.
- Error bars may now be drawn in a color other than black. You may also specify an error bar frequency on the Error Bars dialog.
(Previous versions used the symbol frequency setting). Modified the
ErrorBar macro/DDE command to take account of these new
capabilities.
- Find Intersections dialog is now resizable, which might be handy when working with curves that have a long descriptive legend.
- Added ContourResetExtents macro/DDE command,
which is equivalent to the "Use actual displayed limits" setting on the Contour Options dialog.
- Bug fix: For the last several releases [Color(-2,r,g,b)] has correctly set the color of minor grid lines on XY plots, but was
not used to set the border color on 3D/4D plots as described in the Help.
June 16, 2010
Version 2.2.9.1
- Removed a vestige from the days when DPlot did not allow you to set the plot background color: If the Windows window background
color was the same as the selected grid color, grid color was forced to black.
- Added zoom and pan buttons to the Distance from dialog
for 2D data.
- For XY plots, added $XYMIN and $XYMAX text placeholders.
- Added Restrict mouse panning to H/V/45° menu command to the View menu. If checked, then panning a 2D plot by dragging the
mouse is restricted to horizontal, vertical, or 45° increments. If this feature is unchecked, as before, you can get this
same restriction by pressing the Shift key while dragging.
- For the Generate Mesh command, the Extrapolate... checkbox is now disabled for bivariate interpolation, simply because that
feature was prone to blow up with nonsense values and/or crash DPlot. Added quadratic interpolation method, for which the output is
calculated by applying weighting factors proportional to the inverse of the square of the distance to a selected number of input points.
- Bug fix: The "More Curve Fits" function might have crashed with the equation form y=A(x+B)^C if one or more y values were
exactly equal to 0.
- Bug fix: For bar charts with the Shaded Bars option turned off,
the second and all subsequent bars were drawn in black within standard and enhanced metafiles.
May 23, 2010
Version 2.2.9.0
- Added a "Show Example Plots" command to the Help menu, which hopefully along with the "How was this graph created?"
links within the plots themselves will help new users.
- Improved the performance of the Switch Independent Variable command,
particularly for large data sets. In previous versions, unless all curves had the same number of points and the same X values at every
point, the time required was proportional to N^2, where N = number of points in each curve. In this release if operating on curves for
which X is monotonically increasing (which should include almost all data for which this function is meaningful) then the time required is
proportional to N rather than N^2. If that doesn't grab your attention... this operation with 1 million points might have taken a bit more
that 2 hours before, but should take a bit less than 1 second now on fast processors. Thanks to
Richard Swaim for pointing out the problem.
- The Excel Add-In now works properly with the 64-bit version of Excel 2010 (as well as, as before, the 32-bit version
of Excel 2010 and all previous versions back to Excel 95).
- Bug fix: Version 2.2.8.8 introduced a new bug with the FilePrint
macro command. As far as we know the bug only affected the Adobe PDF print driver, but it is possible that other printers
were affected. The result was either a "StartDoc failed" error message, or a more wordy message concerning missing resources.
- Bug fix: This one has been around for a long while. An "optimization" in previous versions of DPlot that based the decision
of whether to throw out or keep a saved bitmap of a graph when resizing a document ended up causing strange problems, primarily with
very large data sets (for which, of course, the optimization was designed in the first place). You might have ended up with the
wrong plot being displayed when you closed a document or activated a different document with the Window menu. This version keeps the
good features of that optimization and throws out the bad.
- Bug fix: Right-click menu options in DPlot Jr for 3D data were not consistent with DPlot Jr capabilities. (Some right-click menu commands
that should not have been shown rightfully did nothing, other right-click commands which should have been shown were not.)
May 8, 2010
Version 2.2.8.8
- Added many new options for the new background image
feature. The "background" can now be drawn in the foreground. You can specify a global transparency value that is applied to the
entire image and/or a transparent background color. Alpha channel in 32-bit PNG images and transparent pixels in GIF and 8-bit PNG images
is now handled as you'd expect in an image editor, for both foreground and background images.
- Added better support for non-US date separators. In this version the Control Panel sDate entry is interpreted correctly when reading files,
pasting data from the Clipboard, or reading dates from text boxes. DPlot continues to accept either a slash or dash as the date
separator regardless of the Control Panel setting.
- For logarithmic scales, added checks to ensure axis labels do no overlap.
- The FFT dialog now allows you to specify the units for the X values of the input. Previous versions forced the units based on an
interpretation of the X axis title. This version also allows you to enter units that are not necessarily a measure of
time. In that case the FFT will have an X axis label of "cycles/<unit>".
- Similarly, added an "other" entry for X units to the Filter dialog, which only serves to change the frequency label for the
bandpass and bandstop filters.
- The Fill to Y reference line option of the Fill Between Curves
menu command now allows you to specify a fill above and/or below the line. Previous versions drew fills both above and below the line
(where applicable).
- Added Tile Horizontally command to the Window menu. Previously this arrangement could only be achieved by a
WindowTile(1) macro command.
- Added Apply buttons to several dialog boxes (more to follow) and shifted the placement of the larger dialogs to the
upper left corner so that you can better see the effect of your changes when using Apply. For all dialog boxes that
include an Apply button, pressing Cancel after Apply reverts to the settings that were in effect when
the dialog box was first opened, which differs a bit from previous versions.
- Bug fix: For semicolon-separated columns DPlot did not correctly handle files with a trailing semicolon.
- Bug fix: RND(<any number less than 1>) crashed. Under the same circumstances
you will now get a friendlier "Illegal argument" error.
- Bug fix: Printing with the FilePrint macro
command resulted in portrait orientation, regardless of whether you had previously used the Page Setup menu command or
FilePageSetup macro command to set the orientation to
landscape.
- Bug fix: In the More Curve Fits module, the procedure always failed with a spurious "Overflow error" for the exponential
form Y=A+B*exp(C*X) if B was a negative number. (No overflow actually occurred; the error was due to a faulty check meant to prevent
overflows.)
- Bug fix: For saved bitmap images (BMP, GIF, PNG, etc.) of 2D surface plots, if you selected Crop white space and the
contour legend was shown, the right edge of the image was wide by the legend width. In other words, enough space on the right
was added for 2 copies of the legend.
- Bug fix: An uninitialized data problem might have caused DPlot to crash for fill region(s) with the Fill to Y reference line
option.
- Bug fix: Another uninitialized data problem might have broken text shortcuts used in equations within macro commands or text boxes
in dialog boxes. For example $XMIN used in a ManualScale
command might have been erroneously interpreted as the minimum X for curve 1 rather than the minimum for all curves.
24 April, 2010
Version 2.2.8.5
3 April, 2010
Version 2.2.8.4
- Added options for reference lines to draw a
frame around the reference line label and/or make the label opaque. Modified the
RefLine command to take advantage of this
new capability.
- Added options to 1) Draw contour line labels horizontally. The default is for the label to be oriented with the
contour line at the point it is drawn, and 2) Use either black or white for the line labels based on the luminance
of the background color for "Both lines and shades". By default the labels will always be drawn in
black for this rendering. Added documentation to the
ContourLabelLines command to
account for these new capabilities.
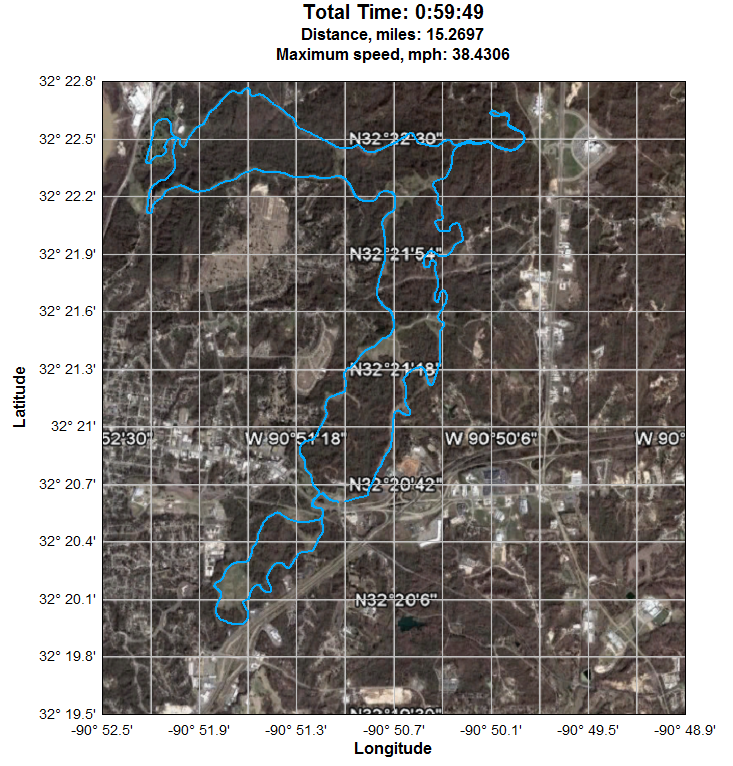
- For Degrees, Minutes and Degrees, Minutes, Seconds
number formats, added an option to
display N, S, E, or W suffixes with the absolute value of the latitude/longitude. Added
NSEW macro/DDE command to control this
setting.
- Added a right-click menu option for point labels to copy the point label text to the Windows Clipboard. Text
shortcuts in the label (e.g. $X, $Y) will be replaced with the corresponding numeric value using the default
number format.
- Bug fix: The change in version 2.2.8.1 allowing a different color for minor grid lines was ignored for polar
plots if you had antialiasing
turned on.
- Bug fix: On XY plots if you used the right-click "Copy data" command, then pasted that curve into a new
document and saved the document with File>Save (rather than Save As), the file was automatically saved to the
same name as the original document, overwriting it.
- Bug fix: On 2D views of random 3D points, if a triangle (formed by triangulating the input X,Y points) was only 1
pixel wide, then a dot would be drawn regardless of whether the Z value was outside the limits specified by
Extents/Intervals/Size.
- Bug fix: For saved bitmap images (BMP, GIF, JPG, etc.) with the resolution set to higher than 100 dpi (lower resolution
settings are ignored), labels added with Text>X,Y|,Z| Labels might have been incorrectly
cropped.
15 March, 2010
Version 2.2.8.3
- Bug fix: Aaarrgghhh. One more fix associated with "better" handling of blank columns in CSV and
other text files that started in version 2.2.8.1. If you had two or more columns and the data was
preceded by a line containing one or more numbers (not necessarily associated with the data but which
might have been, for example, the number of following data rows) then DPlot would initially interpret
that number as part of the data, but then fail to properly read the file.
- Bug fix: Previous versions saved the axis associations of only the first 20 curves to preference files
(File>Save Preferences).
13 March, 2010
Version 2.2.8.2
- For XY plots, removed restrictions for saving data as CSV. In previous versions all curves had to have the same
number of points and identical X values. If either of those conditions were not met then CSV (as well as tab-separated
values) was not given as a "Save as type:" option. In this release, if one or more curves has a different
number of points or one or more different X values, you can save as CSV provided that all curves are sorted in
increasing X order. If a curve does not have a given X, a blank entry is written to the file (two successive
commas or two successive tabs). These will show as blank cells when imported into Excel.
- Added 14 sieve size options for Grain Size Distribution plots, for
ASTM sieves only. These sizes will primarily be useful for those involved in mining operations.
For programmers, modified the
GrainSizeFlags command to handle this
new ability.
- Added Datataker DBD file import plugin to the distribution.
- Bug fix: For 3D surface plots, "Specify extents" to clip values outside specified Z limits did not work
well with custom contour levels.
- Bug fix: The Excel Add-In XYYY command took the correct step of shifting curve legends (from column headings) in
the case of completely blank columns, but it started the shift one column too soon.
- Bug fix: For 2D views of 3D surface plots, the legend might have overlapped title lines and/or the X axis label,
particularly for narrow plots (taller than wider).
- Bug fix: When saving CSV files for XY plots, if a column heading was blank then DPlot wrote nothing to the file
(other than the trailing separator). This caused problems with version 2.2.8.1's new features improving support
for blank data entries, such that DPlot might not have figured out in which line the data started. In this release
blank column headings are written to CSV files as two successive quotation marks.
7 March, 2010
Version 2.2.8.1
- Added a "Expand constants in legend" checkbox to the
Y=f(X) and similar dialogs. If checked,
constants (A,B,C,etc.) used in equations will be replaced with their corresponding numeric values in the
legend (title in the case of 3D surfaces).
- For surface plots from randomly-spaced data, DPlot does a better job of selecting which point the mouse is
hovering over before displaying a popup note with that point's coordinates.
- Improved handling of headings in saved CSV files for XY plots. In previous versions if there was only one
curve, the heading was set to the Y axis label (which might have been blank) regardless of whether the
curve had a legend entry or not. In this version, when only one curve is present then (as before) the Y
axis label is used as the heading; if the Y axis label is blank then the corresponding legend entry is used.
Similarly, if the X axis number format is dates and/or times and the X axis label is blank then DPlot makes
a number-format related decision about an appropriate label: "Date", "Date/Time", or
"Time".
- Right-clicking along the Y axis on an XY plot in previous versions allowed you to set the upper/lower limits of the
Y scale, but only for the primary Y scale regardless of which side of the plot you clicked on. In this version if you
are using two independent Y axes and click on the right side, you are given the option of changing the extents of the
right Y axis. Note that this may not necessarily lead to the expected results: DPlot will always try to find a reasonable
tick mark interval such that each Y axis has the same number of intervals.
- You can now set the color of minor grid lines on XY plots, independent of the major grid color.
- For 3D wireframe plots, if both Borders and Grid are unchecked under Draw on the "Contour Options"
dialog, then element borders will be drawn. In previous versions the default was grid lines, but those lines
are often too sparse to give the surface much definition. If you are plotting more than a several hundred thousand
points, though, this new behavior might result in a plot that is mostly black (or whatever the border color is). In
that case be sure to check Grid and uncheck Borders on the Contour Options dialog.
- Bug fix: DPlot did a poor job of handling CSV files with an abundance of blank entries, particularly if the
last column in the first data line was blank. In many cases DPlot would get confused about which line the
data started in, and/or might have reported that it could not find a pattern of data columns int the file.
- Bug fix: The "Label this point" feature of Edit Mode for XY plots did not pick up the label
unless the label text control was given the focus (and subsequently lost the focus, either by tabbing away
or clicking on another control). The was generally a problem for the second and subsequent labels added with
this feature, which set the default label to the previously-specified label text (so if you were happy with
that default label, there was no reason to give the text control the focus).
- Bug fix: The formatting buttons on the Legend dialog for XY plots did not always work on the first attempt,
particularly when this dialog was opened by double-clicking on the legend.
- Bug fix: The LAS well log file import plugin incorrectly interpreted files containing data lines exactly 256 characters
long, or comment lines longer than 256 characters. There was also a roundoff error in determining the expected number of
data lines for some combinations of START, STOP, and STEP values that might have led to an erroneous error message.
- Bug fix: Axis labels/titles might have been drawn on the wrong side of a 3D view of 3D/4D data if negative scale
factors on the X or Y axis were used.
- Bug fix: Date and Time number format
displayed pre-1900 dates as "########", while Calendar Date format worked fine. The problem was
due to DPlot originally being limited with dates in the same way that Excel is (Jan 1, 1900 through Dec 31, 2078).
DPlot has for many years worked with dates from Oct 15, 1582 through Dec 31, 9999, but the text formatting for
Date and Time number format was not updated to include this capability.
14 February, 2010
Version 2.2.7.8
- Bug fix: Some user-specified tick mark intervals did not work especially well with calendar dates, in particular tick mark
intervals greater than 2 years and less than 10 resulted in a mess of early grid lines at a much smaller spacing, followed
by a large gap.
- The divisor in the Standard error about the line calculation that is one of the outputs of the
Polynomial Curve Fit command has been
changed from n-1 to n-<number of unknowns>. This value now matches the answer provided
by Excel's LINEST function.
- The trial version of DPlot now includes most of the file import and export plugin modules previously distributed
only with the licensed version.
31 January, 2010
Version 2.2.7.7
- Removed all dependencies on DPLOTLIB.DLL functions from the Excel Add-In: all communication with DPlot is now handled
entirely within the Add-In's VBA modules. This should result in fewer Excel security-related errors, and may mean
that the Add-In will work with the upcoming 64-bit version of Excel 2010... stay tuned.
- For the Excel Add-In functions, added a hidden text notation with a description of the source data in the
form "Source: [Filename]Sheet!R1C1". This might be useful for recalling the source of the data in
a saved DPlot file. The note is initially placed at the upper left corner of the box surrounding a plot.
No other consideration is given to the note placement, so if unhidden it might overlap other text entries
(or other similar hidden notes). If you want to see this note (or move it to another location or
delete it), click the Note button on the toolbar.
- Added $NC text shortcut, which is
replaced by the 1-based curve index. This shortcut is only useful in the legend and in the
Operate on X and
Operate on Y commands on the Edit menu.
- Added the ability to specify a range in X to operate on with the
Remove Random Spike menu command.
- Bug fix: Corrected a couple of problems with the SRTM file import plugin.
1) If "Set X:Y scale factors to give proportional ground distances" was checked (and this should have been
labeled X:Y:Z scale factors) then the Z scale factor was not properly calculated, normally resulting in a greatly exaggerated
Z scale in 3D views, and 2) The default tick mark interval was fouled up if the extents were greater than 20 minutes and
less than or equal to 30 minutes.
- Bug fix: Point labels were misaligned
roughly 1/2 character to the left in enhanced metafiles.
- Bug fix: The Integrate macro/DDE command effectively
ignored any previous SelectCurve command; the curve that was integrated may (or may not) have been that specified with
SelectCurve if more than 1 curve was present.
2009 2011
|
RUNS ON
Windows 10,
Windows 8,
Windows 7, 2008,
Vista, XP, NT,
ME, 2003, 2000,
Windows 98, 95
|
|