|
|
Revision History (Archives, 2008)
9 December, 2008
Version 2.2.2.4
- Bug fix: Since the addition of compressed DPlot files, the choice between "Compressed DPlot files" and "DPlot files"
has been flip-flopped when using File>Save rather than File>Save As on a plot that has not previously been saved
as either type. In other words, if you selected "Compressed DPlot files" in the "Save as type" box, the file was
saved as ASCII text; if you selected "DPlot files" the file was saved using ZLIB
compression. Thanks, David Rubin, for the assist in tracking this down.
- Bug fix: Log scales with manually-set extents that were not an integer power of 10 suffered from roundoff problems in some cases. For
example 0.005 might have been shown as 0.00499. This was a consequence of a recent change allowing up to 3 significant figures on
log scales.
- Removed a bit of legacy code that in some cases created an uneccessary delay in loading the Font dialog. In previous versions
DPlot checked for the default printer, and displayed both printer fonts for that printer and screen fonts. For network printers there
was often a substantial delay in retrieving printer information. The delay made sense only for printers that used printer-specific
custom fonts, which to the best of my knowledge are rare in 2008. DPlot does not perform this check in this version, and displays
screen fonts on the Fonts dialog. If there are any users that do use custom printer-specific fonts with DPlot, please
let me know and we'll take a different
approach.
- Bug fix: The fix in version 2.2.2.2 for underflow values (magnitudes smaller than 2-1022) was handled poorly
for 1D plots. This resulted in a crash when double-clicking a saved 1D DPlot file and, worse for new users, resulted in
DPlot crashing if you replied Yes to "Do you want to view the example graphs?"
3 December, 2008
Version 2.2.2.3
- Bug fix: Change in version 2.2.2.2 to reorder point label indices when deleting data points broke the Edit Data
command for new plots: it was impossible to create a new plot using Edit Data.
- Bug fix: When using the Delete Points in Box command, point indices of
point labels were not updated
correctly. The label might have then pointed to the previous or next data point.
- Bug fix: Several versions ago writing the settings file when closing DPlot (or DPlot Jr or DPlot Viewer) was
streamlined and sped up, primarily to get around overzealous antivirus programs being a bit too careful about
files written to your Application Data folder. The end result was to make writing that file much faster for
everybody... that's not the bug :-). The file was wiped clean and only the settings pertinent to a given
program were written to the file. Since DPlot, DPlot Jr, and DPlot Viewer all share the same settings file,
this meant that the most recently used equations, for example, were not saved when running DPlot Jr or Viewer.
More importantly for licensed users of DPlot, your registration information was not written to the file if you
ran DPlot Jr or DPlot Viewer, so you'd be prompted for that information again the next time you ran DPlot.
30 November, 2008
Version 2.2.2.2
- Modified Polynomial Curve Fit command to
modify the input X and/or Y values for probability scales such that the resulting fitted curve will have the
expected shape on the given scale. This was previously done only for logarithmic scales and probability scales
on the Y axis. In this version, for example, a 1st order fit on a Probability X, Logarithmic Y
scale will now have the form log10y = C0 + C1NORMINV(x,0,1) and appear as a
straight line on that scale.
- Dialog box text boxes that take an X or Y value when the corresponding scale uses a calendar date now pay more attention to the user's
date and time formatting. In previous versions a date and time
were always formatted as M/d/yyyy h:mm:ss tt (possibly including fractional seconds). In this release the order of the day and month is
preserved, as is the 12-hr vs. 24-hr clock setting. (Previous versions might have led to errors in interpreting dates if the day and month
were ambiguous - that is, both less than or equal to 12.)
- Bug fix: When deleting or inserting data points using the Edit Data
command, point indices of point labels were not updated
correctly. The label might have then pointed to the previous or next data point.
- Bug fix: The Colors dialog for XY plots showed any non-blank legend entries for each curve index, whether that
curve existed or not. This might have led to a bit of confusion when selecting colors.
- Bug fix: It was possible to send out-of-range small numbers (absolute values less than 2-1022) to DPlot through DDE
(typically from other programs using DPLOTLIB.DLL). Internally this caused no problems; these values were simply truncated to 0
if used in any further calculations. But if these values were saved to a DPlot file or other ASCII text file and then re-read
by DPlot, the result was generally a crash. Thanks to Andreas Martin for
help in isolating the problem.
- Bug fix: Space was reserved for a Y axis label on polar plots even though the label is never drawn. In this release the
Y axis label entry on the Titles/Axes dialog is hidden for polar plots and plot position is not adjusted for any
axis label that might have been entered with a different scale type or programmatically.
- Bug fix: Hit tests (finding a data point and/or curve clicked on with the mouse) did not work well on polar plots and
triangle plots. This test was used with Edit Mode, popup coordinate windows, and right-click menus.
9 November, 2008
Version 2.2.2.1
- Bug fix: A change in version 2.2.1.7 might have led to DPlot crashing after reading data files if the
"Automatically read preference file based on filename"
option was checked.
- Bug fix: Starting with version 2.2.1.0, a synchronization problem with updating settings upon exit might have
resulted in the settings file being deleted if one or more macro editor windows were open at the time you shut
down DPlot. This meant losing previously-used equations, default paths, line widths, etc. For licensed
users this would also result in being forced to re-enter your license information the next time you ran
DPlot.
7 November, 2008
Version 2.2.2.0
- Bug fix: Reading a preference file might have caused DPlot to crash, due to a mistake in storing the 2.2.1.8 setting
for clipping symbols.
- Bug fix: The "Use settings for current plot" option of the Excel Add-In worked correctly
only on Windows Vista.
5 November, 2008
Version 2.2.1.9
- Bug fix: The "fix" for the List Peak Values
command in version 2.2.1.7 might have resulted in a divide by 0 error and subsequent crash.
- Bug fix: The List Peaks in Range command did not work properly if DPlot was not maximized.
4 November, 2008
Version 2.2.1.8
- Bug fix: The setup program for version 2.2.1.7 inadvertently included a section of test code for installing the
Excel Add-In. If the Add-In had been previously installed, the setup program would delete it but fail to install
it as far as Excel was concerned. Running the setup program again would generally fix the problem.
- Added the ability to set the opacity of symbols on XY plots, with values between 0 (completely transparent) to
100% (opaque, the default). This feature might be useful for showing the density of data points on a plot. Opacity
is ignored for output to metafiles and to displays with color depth of 256 or fewer colors.
Added SymbolOpacity macro/DDE
command to change this setting programmatically. Thanks to Richard Hoffpauir for the suggestion.
- Added the ability to clip symbols at the boundaries of XY plots. In previous versions symbols representing points
within the plot extents were always drawn with no regard for the plot boundary. Added
SymbolClip macro/DDE command.
- Added a couple of checks to DPLOTLIB.DLL functions to prevent bad DPLOT structure elements from
crashing your program. In particular, for XY plots the DLL now checks to ensure that MaxCurves is greater than or
equal to NumCurves.
31 October, 2008
Version 2.2.1.7
- When exporting 8-bit bitmap images, DPlot now forces the use of the more rigorous color quantization routine
for large images (large in this case means more than 3500 pixels wide). The default, faster color quantization
routine performs poorly with large images, often producing the wrong background color and/or replacing symbol or
line colors with the background color.
- DPlot does a better job of estimating bitmap dimensions for image export when you use a resolution setting greater
than 100 dpi. In previous versions, the estimated dimensions were often too small (resulting in parts of the plot
being clipped) or too large (possibly resulting in "Insufficient memory" errors).
- Improved standard error calculation presented by the List Peak Values
and List Peaks within Range menu commands. In previous versions the standard error calculation tended to blow up
(showing "** Overflow **" in the results) for large X values. This was particularly true for calendar
dates on the X axis. In this version DPlot subtracts (Xmax+Xmin)/2 from all X's, which prevents subtracting
two huge similar numbers resulting in a 0 divisor for standard error.
- Bug fix: Legacy code used for the MRU file list used an old Windows API call that limited filenames to 128 characters.
This led to bogus error messages concerning whether the file existed or not, when File>Open on the same file worked
as expected. The same problem existed in several other (though less likely to cause problems) places, primarily with
Preference files.
- Bug fix: The AddCurves,
SubtractCurves, and similar macro commands
might have crashed DPlot if one or both of the input curves had non-positive X values and the plot used a logarithmic
scale on the X axis.
- Bug fix: For multiple column text files, if the last column contained a comment or other entry you elected to ignore (using
"Pick columns to plot") but that column contained text that might be interpreted as one or more numbers,
DPlot failed to read the file properly.
11 October, 2008
Version 2.2.1.6
- Most of the dialog boxes that show a list of curves are now resizable. When resized, the list box grows along
with the dialog width. This might be handy for very long legend entries.
- The "Distance from" output now includes nautical miles in addition to statute miles and kilometers when
used on a plot (2D or 3D) with either "Degrees, Minutes" or "Degrees, Minutes, Seconds" number
formats used on both the X and Y axes. As with previous versions, the distance calculation assumes the plot is on
the surface of the Earth.
- If you use "Different error values for every point" and both the positive and negative amplitudes are 0,
no error bar is drawn at that point.
- The Excel Add-In and associated files are now copied to the DPlot destination folder as well as the
%APPDATA% folder. This change was made primarily to assist users with limited privileges for whom DPlot was installed
by an administrator: they'll still need to go through a couple of additional steps to get the AddIn installed properly.
For details see Using the DPlot Interface Add-In for
Microsoft Excel
- Bug fix: If "Unique colors for each bar" was set as a default value for bar charts, then for other plot
types DPlot might have saved too many colors to a DPlot file. This would subsequently result in an error message
when reading the "ColorsEx" entry from a DPlot file.
- Bug fix: The "fix" in version 2.2.1.4 for the XYYY command with a varying number of
rows in the selected columns might have resulted in not very helpful Excel error messages, and the function
would then fail to produce a plot.
27 September, 2008
Version 2.2.1.5
- Improved initial coefficient estimates for the power series equation form (y=AxB+CxD+...) in
the "More Curve Fits" module. In previous versions the initial estimates were all but useless, and the
solution procedure rarely converged to a good solution unless you manually entered good initial guesses.
- Bug fix: DPlot might have entered an endless loop while "Finding extents of data ..." when
using a log scale with one or more curves hidden if any of those hidden curves included non-positive values.
24 September, 2008
Version 2.2.1.4
- The Integrate command now allows you to select multiple curves to operate on.
- If a CSV file contains a date/time group in the first column, the number format for the X axis is set to
"Date and Time" rather than "Calendar Date", as it was in all previous versions.
- When reading a CSV file DPlot will now interpret one or more spaces delimited by quotation marks (e.g. " ") as
a blank entry (either numeric or a text label, depending on previous rows) rather than a text string. This change was made
to accommodate output from Windows' Perfomance Monitor (perfmon.exe), but might also effect output from other
applications.
- Bug fix: The popup tooltips displaying data point coordinates might have been stranded on the screen if you used
the keyboard shortcuts for Undo and/or Redo.
- Bug fix: Symbols in bubble plots may not
have been clipped properly if you zoomed in or otherwise set the plot extents.
- Bug fix: The Excel Add-In XYYY command retrieved the number of data rows from the last selected column,
which worked fine unless the last column had fewer entries than previous columns. In that case data from previous columns
after that last row was ignored.
- Bug fix: The LAS well log file import plugin did not allow you to pick data sets that did not have a description (the text
following the : in the ~C block). In addition, the plugin now allows you to choose between the description, the mnemonic,
and "none" for the legend entries of each curve.
22 August, 2008
Version 2.2.1.3
- For 3D/4D scatter plots, the behavior of the OK button on the Options dialog now mimics the same for 3D/4D surface
plots: if you click OK w/o making changes, or click OK after clicking Apply and there are no subsequent changes,
the plot is not redrawn. This can be a significant time savings for very large data sets.
- Cleaned up a few minor problems with mouse-related code. When zooming and performing other operations that
trapped the mouse, the normal checks for mouse position and clicks were still performed. So you might have
seen inappropriate messages on the status bar or have been able to bring up a right-click menu at an
inappropriate time.
- Amended the Excel Add-In ZGrid command to properly
handle blank cells. Also added ZScatterTable
Add-In command, which is similar to ZGrid but produces a scatter plot rather than a surface plot.
- You may now use environment variables in the filename argument for a
FileOpen command. For example:
[FileOpen("%USERPROFILE%\My Documents\DPlot\test.csv")]
will be interpreted as
[FileOpen("c:\Documents and Settings\<username>\My Documents\DPlot\test.csv")]
on most Windows XP systems.
- Added Title1, Title2, Title3, and Title4 request items, which may
be used in a call to the DPLOTLIB function DPlot_Request
or more generally in a DDE XTYP_REQUEST transaction to retrieve any of the four title lines of a plot.
- Added code to each of the DPLOTLIB example programs to eliminate the possibility of multiple simultaneous
calls to DPLOTLIB functions. Generally this was an issue with large plots and an itchy trigger finger on the mouse, and
might have resulted in a "DPlot is busy" or similar error message.
- On the Note dialog box, if Draw arrow to
is checked then you can click on a plot to specify the location that the arrow points to. Also added new
Snap cursor to nearest data point box. If checked and you click within roughly 100 pixels of a data point,
the text boxes will be filled with the coordinates of the closest point, rather than the scaled mouse position.
You may also use the mouse to click on the desired location of the note.
- Bug fix: Text notations were not drawn in the correct location in 3D projections of 3D/4D data unless the
X:Y:Z scale factors were 1:1:1.
- Bug fix: With the "More curve fits" exponential equation forms, if the input data was exceptionally
noisy then the procedure failed to come up with meaningful initial guesses. This in turn might have led to
an untrapped overflow error, causing DPlot to crash. The curve fit module now does a better job of finding
useful initial values for the coefficients, and also does a much better job of trapping overflow errors for
exponential fits.
- Bug fix: When saving a file the default file extensions were fouled up for all file export plugin formats (wav files
and all bitmap images) if you did not specify an extension in the Save As dialog. This problem has existed
in the last several releases.
- Bug fix: The procedure used to determine file type when you a) drag/drop a file onto DPlot, b) use Explorer's
"Open with..." feature, or c) open a file with a [FileOpen()] macro command w/o specifying the file type
was broken on Windows Vista if you attempted to open a file below the \Windows folder. (For example a WAV file
in C:\Windows\Media.)
- Bug fix: Introduced a new resource leak starting with the 32-bit Toolbar Icons command on the View menu in
v2.1.8.1. If you produced several thousand plots without shutting DPlot down you would likely run into problems on
all systems other than Vista.
- Bug fix: The Histogram command crashed if the input
magnitudes were all identical.
12 August, 2008
Version 2.2.1.1
- By popular demand, increased the transparency of the new zoom-in cursor.
- Bug fix: Version 2.2.1.0 broke the ability to retrieve X,Y values for a curve with an XTYP_REQUEST
DDE transaction. Older versions worked by specifying the curve index as CurveNN, version 2.2.1 worked with
CurveNNN (three places rather than two). This version will correctly interpret all of Curve3, Curve03, Curve003, and
Curve<any number of 0's>3 as a request for Curve 3's data.
8 August, 2008
Version 2.2.1.0
- Several changes related to linked data:
- DPlot cleans up the list of previously-used links that appear on the
Insert Link dialog, removing duplicates.
- When using Insert Link, if DPlot cannot establish a connection with the server it will prompt for whether you
want DPlot to find and launch the server. If the server is found (or if DPlot successfully launches it) but
the topic (normally a filename) isn't open, DPlot will automatically attempt to open that file and establish a
connection.
- Links established either with Insert Link or by checking the Link box on the
Paste Special dialog are now saved with DPlot
files. When you re-open the DPlot file DPlot will attempt to reestablish the link. If a connection cannot be
established DPlot goes through the same steps mentioned above. If a connection cannot be made (possibly because the
file used by the server has been renamed, moved, or deleted) you'll still get a plot, since the data was written to
the DPlot file.
Please note: For Microsoft® Office and most server applications
DPlot should not have a problem finding the application given the service name (e.g. "Excel") if it is not
already running and/or the topic file is not open. At this writing, for OpenOffice Calc and other OpenOffice applications
this is not the case: if the server application is not running or if the topic file is not open in that application,
reopening a DPlot file with an embedded link or attempting to "Insert Link" under the same circumstances will
result in a "Cannot connect with..." error. It is certainly possible that this problem exists with other
applications we have not tested. If you have a similar problem with some other application please
let me know what application you're
dealing with and the next release may cover it.
- Depending on what anti-virus program you use and what settings for that program were in effect, DPlot might have taken
much longer than necessary to shut down (as in 5-10 seconds instead of less than 1 second). This was due to updating
the settings file %APPDATA%\DPlot\dplot.ini with several hundred individual writes. In this version the settings are
written to memory and the entire file is replaced in a single write operation. This gets around overzealous virus scanning
software and is generally faster whether you previously noticed a delay or not. The original problem was only noticed
on Vista, but the solution will most likely benefit all Windows versions.
- Reference lines may now be associated with secondary
X or Y axes set with the Multiple Axes menu
command.
- Amended the SRTM file import plugin to optionally fill in voids in the data with an
interpolation of the surrounding points. Also fixed a bug: the plugin might have become unstable if you elected to
plot a subset of the file and subsequently opted to plot the entire contents of the same file.
- Minor changes were made to the LAS (Log ASCII Standard) well log file import plugin based on user input. Have more
suggestions? Let me know.
- Added a Combine data sets command to the Edit menu for 3D and 4D scatter plots. This function will move all
of the data points from the selected sets into a single set.
- Added right-click menus to 2D contour plot contour line labels, to control the font, frequency, and other attributes
of those labels.
- Bug fix: When pasting data from the clipboard DPlot prefers HTML tables over plain text, if HTML format is available. But
DPlot did not properly handle HTML format produced by MS Access, usually displaying the error message "Unable to
find a pattern of data columns in clipboard text." This version properly handles Access-produced tables.
- Bug fix: The Draw line segments between points setting for 3D and 4D scatter plots was not saved to DPlot files.
- Bug fix: File import plugins that show a dialog box might have failed to show that dialog box if a) an earlier
attempt resulted in an "insufficient memory" error message and b) you subsequently tried to open the same file.
And... not so much a bug, but a design flaw: if you renamed a plugin then it would fail to display its dialog box if one
existed. Thanks to Don White of Pacific Instruments for the
assist.
- Bug fix: If a plot had no first title line but did have a second, third, and/or fourth title line, those entries
might have been shifted down farther than they should have been, possibly overlapping the plot.
25 July, 2008
Version 2.2.0.3
- Starting with version 2.1.8.0 the Equal Intervals command
was very inefficient in finding the bounding input X values for an output X. With several thousand input points the delay was
insignificant; with several hundred thousand points or more this command was very slow, by a factor of 100 or so compared
to this release.
- Bug fix: Version 2.2's change removing a needless redraw when activating/deactivating document windows caused a problem at startup
if you launched DPlot by double-clicking on a file associated with DPlot or ran DPlot with the Windows Run command with a file
specified on the command line. Best case, this problem resulted in the file not being opened. Worst case, this problem caused
DPlot to crash.
- Bug fix: For selected symbol types, if you used a symbol frequency greater than 1 and the curve contained more than 1024 points then
DPlot might have produced spurious extra line segments drawn from the last symbol within each block of 1024 points to the first data
point in the next block of 1024 points. This problem generally effected metafiles and/or non-solid linestyles.
24 July, 2008
Version 2.2.0.1
- Bug fix: In version 2.2 DPlot crashed if you selected a file from the most recently used list on the File menu if the
file was not found. In addition to fixing the bug, DPlot will now offer to remove that entry from the list.
24 July, 2008
Version 2.2
- DPlot files may now be saved with ZIP-like compression, and be re-opened by DPlot. This new feature makes use of the
ZLIB compression library. For moderate plot sizes you will typically get
a compression ratio of 2.5:1 to 4:1. Happily, for larger files the compression is often much better; in test cases I've achieved
12:1 for 100Mb files. In extreme cases (long runs of identical values, for example) the compression ratio can exceed 400:1, but
this is of course unusual. These are not ZIP files and cannot be opened by
WinZip® or similar archive utilities.
The downside to creating compressed DPlot files is of course that they cannot be edited with a text editor unless they are first
decompressed, nor can they be opened by older versions of DPlot.
- Removed a bad bottleneck when working with large data sets. In previous versions if a document window was maximized and you
activated another document, then switched back to viewing the original document, the plot was redrawn from scratch rather
than simply displaying the saved bitmap of that plot. It was redrawn because the action of activating a maximized
document causes all other documents to be "restored" and thus resized, though they are hidden. This led DPlot to
delete the saved bitmaps in preparation for the next time the window was displayed.
- Added the ability to set the background color of the area bound by the coordinate axes. (Recent versions include the ability
to set the background color of the entire document, not restricted by the axes.) Added
BkPlotColor macro/DDE command to set this color. See the
new Maps page for an example of this capability in action.
- DPlot does a better job handling tick mark intervals saved to DPlot files with one of the degrees or time
number formats. If, for example, you used
a tick mark interval of 5 minutes then this value was saved to a DPlot file as 0.0833333333333 (degrees), which might
seem precise enough, but... wasn't. In this case DPlot rounds to the nearest minute if the error in doing so is
less than 1 second (and in this case it is).
- Modified Excel Add-In XYYY command such that it ignores hidden
columns.
- When interpreting multiple column text files and/or columns of values from the Clipboard, DPlot did not correctly parse
text labels containing spaces unless the labels were delimited with "quotation marks". For comma- and tab-delimited
files DPlot will now interpret those labels correctly.
- Made several minor improvements to processing multiple-column text files: If the line preceding the data consists of all dashes or
equal signs then column headings are grabbed from the previous line. For space-delimited files if the first two columns are date
and time, then the labels for date and time are combined (this previously worked only for comma- and tab-separated columns).
- Improved the hit test when checking to see whether you've clicked the mouse on a curve. DPlot won't register a hit
on a line segment that isn't drawn, whether because the line style is 'None' or because of the Amplitude Limits
setting. This change has no effect on clicking near a data point.
- Modified the results reported by the Distance from command. If the X and Y values both use Degrees, Minutes or
Degrees, Minutes, Seconds number format
then DPlot assumes these values are longitudes and latitudes on the Earth's surface and reports the distance between
points in miles and kilometers.
- The Legend macro/DDE command is more forgiving if you specify a
curve argument that is greater than the current maximum number of curves. In past versions DPlot presented an error
message and stopped the macro. In this version the command is simply ignored. This might be handy when used in loops in which the
number of curves is unknown beforehand.
- Added a... well, a bit of a hack... to correct a problem caused by Vista Aero. If the application was maximized and the active child
document window was maximized, the child document was short on the right side. Depending on screen resolution it might have been
4 or 16 pixels short, with the gray client area showing to the right. The problem did not occur with Windows Vista Basic or with any
other 32-bit version of Windows, nor was it isolated to DPlot; it seems to be a problem in any MDI application using basic Windows
MDI functionality (not MFC or VB, for example).
- For the licensed version, added a file import plugin for LAS (Log ASCII Standard) well log files. For more information on LAS files see
the Canadian Well Logging Society web page.
- Bug fix: Point labels did not keep the intended relationship with your data when using Edit>Sort (assuming the data needed sorting).
In other words if a label pointed to the nth point in a curve before sorting, it would continue to point to the nth
point after sorting regardless of whether point n was moved.
- Bug fix: Using the Swap X,Y command with a
Mercator Projection caused DPlot to crash if all (previous) longitude
values were outside the range +85°
- Bug fix: On Vista, dragging the legend or a note with your mouse, or resizing the graph by dragging plot corners with your
mouse, might have caused DPlot to crash if you took more than several seconds to complete the operation.
- Added a beta OverlayDocument macro command that allows you to overlay one document with another. See the related
General Discussion topic in the forums for more information. This feature is
currently undocumented because it is not complete, and because it is very likely that some users will want to use this feature in
unanticipated ways. This feature will allows to (for now, and for example,) overlay a contour plot with an XY plot, or a bar chart with
a line graph.
11 July, 2008
Version 2.1.8.1
- More toolbar changes and 2 new cursors to get DPlot looking more XP- and Vista-like. The macro editor now also uses 32-bit toolbar
icons. The new icons generally look much better on an LCD display than on a CRT. For those that prefer the old 4-bit bitmaps, for
whatever reason, added a "32-bit Toolbar Icons" command to the View menu. Uncheck that menu item to use the 16-color
button images. (As in the previous version, 32-bit bitmaps are only available on Windows XP or later with a color depth greater
that 256 colors.)
- Bug fix: If the toolbar was dragged away from the top of the DPlot window so that it became a floating window,
the Zoom in and Distance between points buttons no longer worked correctly.
- Bug fix: If (for whatever reason) the \Preferences or \Macros folders below %APPDATA%\DPlot were removed without
reinstalling DPlot, subsequent attempts to save a default settings file (e.g. after clicking "Make defaults"
in the Colors dialog) or to save a macro failed. In this version DPlot will create those folders at startup if
they do not exist, and has better error checking when attempting to save files to those folders.
6 July, 2008
Version 2.1.8.0
- Added 32-bit toolbar icons and made several XP theme-related changes to the toolbar. The old 16-color toolbar
button images will still be used on Windows 2000 and previous versions, and on systems with a color depth
of 256 or fewer colors.
- Added IndependentTicks,
MultipleXAxes, and
X2AxisLabel
macro commands. IndependentTicks controls whether tick marks on a second X or Y axis are drawn independently
of the primary Y axis when grid lines are used. The default state with grid lines is to draw labels at the
grid lines.
- For the X=f(T), Y=g(T) command, Y may
now be a function of X instead of or in addition to T. In previous versions if X were used in the Y equation
it was evaluated as 0.
- The Equal Intervals command will now work on
unsorted input values. If the input curve is not sorted in increasing X order, a sorted copy of the input is
generated and operated on. Similarly, points with duplicate X values are removed from the input, with the Y
value at the point set to the average of all points sharing that same X. In previous versions you could not
use Equal Intervals on unsorted curves. If no curves on a plot were sorted then the command was disabled.
- A couple of bug fixes for log scales, and one new feature:
- If an extent was not an integer times a power of 10, DPlot skipped over the label nearest that extent
for an integer times a power of 10. For example if the upper extent was set to 13, the label for 10
was not drawn.
- For dense grid lines and labels drawn at every grid line, DPlot was a bit too aggressive in culling
out labels based on whether they would fit between previously drawn labels.
- This version of DPlot allows 3 significant figures in log scale extents. Previous versions were limited
to 2 significant figures. For example if the upper extent were set to 12.5, DPlot would force the
upper extent to 13.
29 June, 2008
Version 2.1.7.9
- Cosmetic changes only. This version handles XP themes better than the past several releases. Specifically, the
Error bars dialog is drawn correctly on XP and Vista, whether themes are enabled or not. On Vista there were also
several problems with buttons using bitmaps - primarily text formatting buttons and color selections on the
Contour and Scatter Plot Options dialogs. Licensed users can get this update using "Check for Updates"
on the Help menu, or from the link in the last update notice if you are on the mailing list. Licensed users
who are not on the mailing list and purchased DPlot within the last two years may
sign up
to receive instructions for downloading this update.
26 June, 2008
Version 2.1.7.8
- Symbol outlines on XY plots may now be any color (previous versions were limited to black outlines). Added
SymbolOutlineColor macro/DDE command to handle this
new capability.
- Added a switch to fill the interior of hollow symbols with the plot background color on XY plots. Added
SymbolFillBackground macro/DDE command.
- Changed the behavior of logarithmic scales with dependent X or Y axes. In all previous versions tick marks were drawn on the dependent
scale at the same position as the tick marks on the primary scale, and the labels were the values from the primary scale with the
scaling equation applied. For example with a primary scale of inches from 1 to 10 a dependent scale in centimeters would show values
of 2.54, 5.08,...,25.4. In this version if you choose a box around the plot with tick marks or grid lines with "use independent
tick marks on dependent scales" checked, then the secondary scale will show tick marks and values at more natural intervals. In
this example 3,4,5,...,10,20 centimeters, depending on the options selected for log scale tick marks.
- The second Y axis label (used for multiple axes) may now be rotated 180 degrees such that the base of the text faces the plot.
Added Y2TopDown macro/DDE command to change this setting programmatically.
- Added formatting codes for overbar (also called overline), e.g "{\oX}=23.6" will be presented as
X=23.6. You may also add characters from the Wingdings, Wingdings 2, and
Wingdings 3 fonts to title lines and axis labels, notations, legend entries, point labels, etc. For more information see the
Help topic for the specific text entry you'd like to use these features in.
- Modified the behavior of View>Zoom. You can press the <Esc> key to abort the operation either before clicking on the
plot or while dragging. And if you simply click on a point rather than dragging, or if the zoom rectangle has no area (height or width are 0),
Zoom is now equivalent to the
CTRL+2 keyboard shortcut: the plot will be zoomed by a factor of 2 on the current mouse
position.
- Bug fix: It was possible to cause DPlot to enter an endless loop with a logarithmic scale on the Y axis after hiding several curves if
"Recalculate extents of XY plots after hiding/unhiding curves" was checked.
- Bug fix: Starting with version 2.1.6.7 you've been able to resize a 2D plot by dragging plot corners with your mouse. As a consequence of
that change, zooming in on a plot with the final cursor position in any corner of a plot might have resulted in a stranded drag
handle (an inverse video square) in that corner.
- Bug fix: The macro editor might have crashed on a ForFilesIn loop if no files matching the specification were found.
- Bug fix: Antialiasing was temporarily turned off when viewing the Symbol/Line Styles dialog. If you accepted changes on that dialog
(which caused an undo file to be saved), and subsequently used Edit>Undo to undo those changes, antialiasing was turned off, because
it was turned off at the time the undo file was saved.
15 June, 2008
Version 2.1.7.7
- Fixed a couple of conflicts that caused problems with the DPlot document icon (primarily in Explorer). For those that follow this sort of
thing: 1) The default options with the UPX compressor end up destroying all but the first embedded icon in the executable. UPX has been used
instead of ASPack with the last half dozen or so versions because ASPack-compressed executables ended up giving an invalid digital signature
on Windows Vista. 2) Including a manifest file (used to force DPlot to use XP-style dialog controls) in the executable's resources didn't
work well with the resource compiler used with DPlot. In this release the manifest file is not compiled into the executable but is kept
separate, which has the added benefit that if you don't care for the XP-style controls, you can delete dplot.exe.manifest and restore the
Windows 2000-style controls. Installing the update should fix the document icon used for documents associated with DPlot. If it doesn't
(because you've attempted to solve the problem yourself), it may be necessary in Explorer to select Tools>Folder Options>File Types,
select GRF files, then click the "Restore" button if it is present. In isolated cases it may be necessary to reboot, but this is
unlikely.
13 June, 2008
Version 2.1.7.6
- Added keyboard shortcuts for zooming in on XY plots and 2D views of 3D data.
CTRL+2, CTRL+3, CTRL+4, and CTRL+5
zoom in by factors of 2, 3, 4, and 5, respectively, centered on the mouse position. If the mouse is not within the plot when these
shortcuts are used the new extents are centered on the current center of the plot. CTRL+1 is equivalent to selecting
View>All.
- Bug fix: If the Force circular plots option for polar plots was
checked and you did not specify the plot size under Options>Extents/Intervals/Size
then DPlot fouled up calculating the largest possible plot size to fit a printed page, which in turn caused fonts to be scaled down to
the point that in most cases they were not legible.
8 June, 2008
Version 2.1.7.5
- Bug fix: If Engineering Number Format was used
along with a checked Fixed number of decimal places, DPlot might have crashed when moving the cursor across the plot.
4 June, 2008
Version 2.1.7.4
- Bug fix: Version 2.1.6.8's feature of setting the legend for data pasted from DPlot to "Copy of..." was poorly
implemented, and caused memory problems when pasting data from (primarily) Excel. The problem generally resulted in a
crash after pasting more than about 50,000 points.
- Amended SRTM file import plugin to allow you to skip rows/columns in the file. The resulting
plot is of course coarser, but this feature will allow you to plot a full 1°x1° grid without hogging > 100Mb RAM.
- Amended Garmin GPX/Training Center file import plugin to plot speed in addition to
elevation and/or heartrate. Speed is not a direct measurement but is derived from distance and elapsed time. For GPX files
(as opposed to Training Center TCX files), distance calculation is slightly more accurate than in initial version.
- Improved error messages for out-of-memory conditions for 3D views of 3D data. This generally was not an issue before
adding support for SRTM files.
2 June, 2008
Version 2.1.7.3
- Notes may now be center- or right-justified.
- Added support for reading point labels from the third column of text files (using file type "D" e.g. CSV files) for XY
plots, the fourth column for 3D text files (file type "K") and from the Clipboard when using
Paste Special. To read labels from a text file you must check the "Pick Columns to Plot" box on the
Open dialog box.
- For the licensed version only, added support for Garmin GPX/Training Center files and for
NASA Shuttle Radar Topography Mission (SRTM) elevation data.
- Amended the behavior of Box-and-Whisker plots and Dot Graphs using the new logarithmic scaling feature. For log scales, the
mean is taken as 10 raised to the power of the mean logarithm. For mean-based Box-and-Whisker plots, the box and whisker
limits on logarithmic scales are Mean + (Std. Dev. or Std. Error)^(multiplier).
- Changed how fonts are resized on a display when "Specify plot size" is not selected. In previous versions
fonts were always scaled down by the ratio of the actual document window size to the size of a maximized document within
a maximized DPlot. This worked well if you typically ran DPlot maximized, but with today's larger monitors many users
don't run DPlot maximized and fonts were often scaled down to the point of being illegible. In this release this
font scaling only takes place if the document window's client area is smaller than 800x600. This change has no effect
if "Specify plot size" is used; in that case font sizes are, as before, kept proportional to the specified plot size.
- Added Catenary curve equation form to the
curve fitting plugin.
- Eliminated unnecessary redrawing when restoring DPlot from a minimized state.
- Bug fix: International settings for decimal points and number formats other than the default caused problems for
text placeholders within equations within titles, legend entries, notes, etc. For example if your decimal symbol
was a comma then "Log(Mean)=$=(log($MEAN(1)))" with $MEAN(1)=10.2 would have been evaluated as log(10,2), which
would then be replaced with "Log(Mean)=<Too many parameters>". Other number formats might have resulted in
"<Syntax error>".
- Bug fix: The recent addition of the "Label Location" controls on the Point Labels dialog box did not take
into account that labels might have been added programmatically and the location set to an offset value rather than
absolute coordinates. Fixed this problem and added an option to specify the location as either an offset in physical
units or as an absolute position in data space.
- Bug fix: Undo did not work properly on several point label changes.
- Bug fix: Many text boxes on dialog boxes use the same number formatting as the corresponding axis. For the most
part this has worked fine, except that percentages were not interpreted correctly. If you entered or accepted
a value as <number>%, DPlot most likely replied with the error message "Syntax error: unrecognized
symbol."
- Bug fix: The ZTABLE plugin did not correctly handle some combinations of column separators. Commas, tabs, and spaces all worked
correctly, but, for example, a space followed by a comma followed by another space did not. In the worst case this might
have caused the plugin to crash DPlot.
- Bug fix: Precision problems might have caused strange results with "Degrees, Minutes, Seconds" number formatting;
e.g. 5° 10' 0" being presented as 5° 10' 1.24E-12"
- Bug fix: In the last several releases the licensed version has fouled up with new installations on Windows Vista,
reporting "LoadLibrary failed on..." with all plugin modules until you correctly entered your license
information and restarted DPlot.
24 May, 2008
Version 2.1.7.2
- Amended operation of the DeleteRefline
macro/DDE command. If the index argument is 0, the last-created reference line is deleted.
- Added $LENGTH Text placeholder
for XY plots. $LENGTH is replaced with the dimensionless length of the associated curve.
- Bug fix: Truncate X might have operated on the wrong curve(s) if any curves were omitted from
the list.
- Bug fix: If Mercator Projection was
selected for the first document then any subsequent documents for which
Amplitude Limits was not
explicitly set OFF would have amplitude limits turned on and set to +/- 85. In plain English, the
Y values on new plots would be limited to +/- 85, with points outside that range ignored.
- Bug fix: If Elapsed Time
Number Format
was used on any axis then the display of the data values using the
Edit Data menu command was
fouled up.
- Bug fix: Reference Lines dialog
did not use sufficient precision in the reference line value when the corresponding axis used one of
the time number formats and the value included fractional seconds. The reference line was drawn at
the correct location initially, but re-opening the dialog and clicking OK without making any changes
would result in the value being truncated to whole seconds.
- Bug fix: Numbers entered in dialog boxes in hexadecimal format (i.e. 100=0x0064) were not interpreted
correctly. Attempting to do so usually resulted in an erroneous MessageBox concerning the lack of an
operator in the "equation".
15 May, 2008
Version 2.1.7.0
- No changes in functionality. Changed the compression program used to reduce the size of all executables
so that Windows Vista will correctly report "The digital signature is OK". In all previous
versions, Vista erroneously reported "The digital signature is not valid", which might have
caused some concern by administrative types or anybody who pays attention to code signing.
14 May, 2008
Version 2.1.6.9
- Bug fix: (Trial version only). Version 2.1.6.8 contained a certificate verification routine that failed on
Windows Vista.
12 May, 2008
Version 2.1.6.8
- Box-and-whisker plots and dot graphs
may now have a logarithmic scale. Scaling may be set programmatically with the new
Stat_Scaling
macro/DDE command.
- For XY plots, if you copy/paste a curve into the same document then the new curve's legend will be
"Copy of <source legend>", or "Copy of Curve x" if the source
curve has no legend entry.
- Increased the maximum number of reference lines from 50 to 100. (This was needed for a user plugging in many
reference lines in place of grid lines at desired locations different than those chosen by DPlot. New options
for grid lines will be coming soon.)
- Bug fix: The legend in 2D contour plots might have been clipped when saving a bitmap image and/or copying
a bitmap to the Clipboard.
- Bug fix: An error in processing Campbell Scientific datalogger files might have resulted in overwriting
another area in memory, causing later unpredictable behavior. In the last DPlot update this might have
resulted in a false positive when testing for a pirated version of DPlot.
2 May, 2008
Version 2.1.6.7
- Probability scales may now range from 0-1 instead of the default 0-100. Among other things, this allows you to
use Percent number formatting on a probability scale. Amended
ProbabilityFlags macro/DDE
command to take account of this option.
- For Bubble plots, the mouse hover tooltip gadget now shows the bubble magnitude as "Z=" in addition
to the X and Y values.
- The maximum number of decimal places on the Number Formats dialog has been increased from 8 to 12.
- Slightly modified the way Scan X,Y works:
if the Shift key is pressed, then clicking on the scroll bar arrows or using the arrow keys moves 10x whatever
the current increment is.
- Increased the maximum number of plugin modules (Generate, File Import, or File Export) from 20 to 50. This will
primarily be of interest to those developing their own plugins for DPlot.
- Added a placeholder for macro/DDE commands to specify a curve or data set by entering one or more substrings from
the legend associated with that curve or data set. (See the description of the
SelectCurve command.)
For example [SelectCurve(LegendHas("ABC","DEF"))] will select the first curve whose legend contains both
ABC and DEF. LegendHas may be used in any command in place of a curve index. If the search
fails, no replacement is made (which will subsequently result in an error message when attempting to interpret
LegendHas("substring") as a number). Thanks to Ian from Tata Motors
for the suggestion.
- You may now resize a 2D plot by dragging any corner of the plot (in addition to using
Specify Plot Size). When sized using
this method, Specify Plot Size is turned on if not previously on. The size will be rounded to the nearest
tenth inch, millimeter, or centimeter, depending on the default measurement units selected under
Options>General. Dimensions might be
subject to the constraints of the plot type: triangle plots will always be an equilateral triangle, Mercator
projections will retain the correct shape, etc.
- Bug fix: Very long line segments on XY plots (made very long by zooming in or setting the plot extents to
a small fraction of the data extents) might not have been clipped properly. In this release DPlot relies on
its own internal clipping rather than using Windows' built-in clipping algorithm if the plot extents are
less than 1/20 of the full extents of the data, in either direction.
- Bug fix: If "Axes only" was used for the grid type on an XY plot, in metafiles the arrowheads on the
axes might have been clipped.
- Bug fix: The function parser (used in Y=f(X)
and similar commands) might have erroneously returned a "Too many parameters" error for functions
of more than two arguments in which the last argument was another function, e.g.
NORMDIST(x,0,SQRT(0.2)).
9 April, 2008
Version 2.1.6.6
- Preference files will now include line styles, symbol styles, line widths, and symbol sizes for all curves. Previous
versions only stored this data for the first 20 curves.
- Spin buttons throughout DPlot are now forced to the designed width. In previous versions spin button width was
set to the width of a standard scrollbar (user-settable with Control Panel). This led, in some cases, to
overlapping controls if you increased the scrollbar width above the default value.
- Looks only: DPlot now uses the look of XP-specific common controls (buttons, checkboxes, etc.) on XP and Vista.
Welcome to 2003 :-)
- Bug fix: A saved DPlot file containing XY data might have erroneously saved the data as if the X axis had equally-spaced
values if at any time the data did have a constant spacing but you then used Delete Points in Box to
delete one or more values before saving the file.
- Bug fix: A roundoff error might have resulted in symbols being 1 pixel off on logarithmic scales. This was generally
most noticeable with symbols using crossed lines.
- Bug fix: List Peaks might have crashed with 3D data.
- Bug fix: If Data points was checked on the Contour Options dialog for randomly-spaced 3D data, symbols
were drawn at each point regardless of whether that point lie outside extents set with the
Extents/Intervals/Size command.
27 March, 2008
Version 2.1.6.5
- DPlot will now correctly handle blank entries in CSV files for "quoted" values (date and time combinations,
for example). In previous versions blank quoted entries were only handled correctly if represented by two
consecutive quotation marks; for two consecutive delimiters (commas or tabs) in place of a quoted value, DPlot
would have stopped processing the file at that point, deciding that the data type for that column didn't match
the corresponding column in previous lines.
23 March, 2008
Version 2.1.6.4
- Corrected two problems with DPlot's FFT routine that have been present from the start: a) The first point in the FFT
should be equal to any offset from zero in the input record. This value was off by a factor of 2. b) For an input
number of points equal to a power of 2, the output FFT was normalized by dividing by N, when it should have been divided
by N-1.
21 March, 2008
Version 2.1.6.3
- Bug fix: It was possible to cause an integer overflow (crashing DPlot) with the Y=f(X) and similar commands if the
range in values divided by the selected interval was greater than 2^31. This problem has actually been present for years, but
was made much more apparent by the recent change of dynamically showing the number of points that would be generated by the
given extents and interval.
18 March, 2008
Version 2.1.6.2
- A change in version 2.1.6.0 to remember the Pick Columns to Plot setting caused DPlot to display the
Specify Columns to Plot dialog when opening a file on the command line. In this release files opened
by a command line operation will not display that dialog, regardless of whether that option was previously selected.
- Bug fix: If you clipped the Z extents of a 3D view using Extents/Intervals/Size and elected to draw
grid lines on the surface, in rare cases an integer overflow might have caused DPlot to crash, particularly when rendering to
a high resolution device like a printer.
- Bug fix: The Multiple option on the Print dialog might have crashed DPlot the first time you
selected "Select All" due to an uninitialized data problem.
12 March, 2008
Version 2.1.6.1
- Bug fix: A recent change meant to improve on DPlot's default tick mark intervals might have resulted in a crash
if Specify extents was checked and the lower limit was a negative value with a larger magnitude than
the positive upper limit.
- Bug fix: Bar charts were not drawn properly to enhanced or standard metafiles if you zoomed in on the graph
or set the extents of the plot to some subset of the entire data. This bug effected both metafiles copied to
the Clipboard and saved files.
- The Y=f(X) command now presents the from X
and to X values using the current number formatting for the X axis. (Previously, these values always used
the default number scheme). Previous values used in this command will be displayed using more significant figures
than in previous versions (Date and Time, for example, will show times down to microseconds when appropriate).
And the dialog now shows the number of points that will be generated using the from X, to X, and
with interval dX settings. This functionality will be added to the other curve/surface generating commands
in a future release.
6 March, 2008
Version 2.1.6.0
- Amended the BMP, GIF, PNG, and TIF file export modules to optionally use a better color quantization
routine when saving 8-bit images from displays with greater than 8-bit color depth (which, these
days, is just about everybody). The default color quantization method does not work well
in some cases when saving an image with a colored background. The optional method works much better
but comes with a performance penalty, taking several seconds for large images (which might be important
if automating this process and producing thousands of bitmaps). Modified the
SetPluginImageDims
macro/DDE command to include this new option.
- In most all dialog boxes that include lists of curves, the list entries now include a short line segment
and/or symbol in the appropriate color. This change makes it a bit easier to quickly pick the
desired curve from a list, particularly when the curve has no legend entry.
- DPlot does a better job handling calendar date number formats on 3D/4D surface plots. In previous
versions these numbers were treated the same internally as all other number formats, so that it
usually wasn't possible to get, for example, grid lines or tick marks at exact 1 month or 1 year intervals.
- Expanded the list of built-in date formats in the Number Formats dialog from 7 to 24 of the most commonly
used formats. As before, you may select a format from the list or enter your own format.
- Added an option to not draw an inverted scale on the opposite side of the plot from a probability
scale. The default is to draw that inverted scale. Added
ProbabilityFlags macro/DDE
command to set these options.
- Improved on version 2.1.5.5's change in the behavior of the
Force circular plots option for
polar plots. In version 2.1.5.5 the size was set to roughly 80% of the minimum of the document window
width and height. This worked well for most display sizes, but not larger resolutions (unless you used
very large fonts). In this version DPlot will use all available display space.
- The "Pick columns to plot" option for CSV and other multi-column text files is now turned on
by default, and your choice for that option will be preserved. In previous versions this option was
always initially turned off.
- Bug fix: If Outline solid symbols was checked, then symbols from the Wingdings 2 font were drawn
in black.
27 February, 2008
Version 2.1.5.9
- Bug fix: Additional problems (this time with 3D plots and bubble charts) that resulted
in draining GDI resources have been fixed. These problems generally were not apparent until several
thousand plots were created in the same DPlot session. Thanks again to
Sven Henze for the assist in tracking these bugs
down.
18 February, 2008
Version 2.1.5.8
- Bug fix: An obscure problem was introduced in version 2.1.5.6 that resulted in strange problems
(toolbar bitmaps disappearing, all lines being drawn with a single-pixel black line, and other assorted weirdness)
after saving several thousand bitmap images. Thanks to Sven Henze
for the assist in tracking this down.
17 February, 2008
Version 2.1.5.7
- You can now specify the background color of the entire plot, the legend, text notations and point labels. Past
versions always used the Windows' window background color. Added new
BkColor macro/DDE command and modified the
LegendParams,
TextNoteEx,
TextNote3D,
TextPointLabel and
TextPointLabel3D macro/DDE commands to take this new
capability into account.
- Bug fix: Retrieving a DPLOT_PLOTMETRICS structure with DPlot_GetBitmapEx or DPlot_GetPlotMetrics
was broken in version 2.1.5.6.
- Bug fix: If you did not install the Excel Add-In, the uninstall program for DPlot might have produced an Excel runtime error and then
shut down.
10 February, 2008
Version 2.1.5.6
- Changed the behavior of the image export plugins (BMP, GIF, TIF, etc.) to make better use of the resolution
setting. In past versions this setting was only used to set the resolution field in the image header for
formats that supported it (TIF in particular) and otherwise had no effect on the contents of the image.
The result was that in most cases the images saved with the plugins were essentially screenshots. In
this version if the resolution entry is non-zero then font sizes, line weights, and plot dimensions
will be scaled up by resolution/(screen resolution). So if, for example, you have specified
the plot size using the Extents/Intervals/Size
menu command, then the box around the plot will be (size in inches) * resolution pixels. This
change may require you to pay a bit more attention to the image width and size entries. If you use 0 for
either the width or height of the image and do not specify the plot size with Extents/Intervals/Size,
then the output image will be the document window size times resolution/(screen resolution). For
a maximized document window this might easily result in an Insufficient memory error when attempting
to create the image. For best results with a non-zero resolution, always check the Specify size option
under Extents/Intervals/Size.
- Added /sp command line switch for preference files. If /sp is used, the specified preference file will be
processed for all new documents during the current session, much as %APPDATA%\DPlot\Preferences\default.set
is used in all previous versions. The /s command line switch continues to work as in all previous versions:
the preferences file will only be used with files specified on the command line.
- Bug fix: In the last several versions of DPlot if you entered a non-positive value for an extent with a
logarithmic scale using the Extents/Intervals/Size
menu command, DPlot would present the appropriate error message, but then crash.
- Bug fix: DPlot considered the size and position of text notes when finding the extents of metafiles, whether
the text note was hidden or not. This might have resulted in unnecessary white space if a note was placed outside
the extents of a graph and then hidden.
- Bug fix: On an XY plot with only 1 curve whose X values were not monotonically increasing, the
Smooth command proceeded as if everything
was in order but produced no new curve (nor any error message). In this version the Smooth command will
present an error message and suggest using the Sort command on the Edit menu.
- Bug fix: For 3D views of 3D or 4D data, setting the line widths of the major or minor axis lines to a negative
number should have resulted in those lines not being drawn. And it does, unless
Antialias objects on display output is checked
(General command on the Options menu). In this update those lines will not be drawn, regardless of whether
antialiasing is used or not.
27 January, 2008
- Excel Add-In only: The Add-In has handled time-of-day values poorly from the beginning, chiefly because
DPlot expects "Time of Day" numbers to be in hours, while in Excel times are fractional days.
Past versions of the Add-In examined the format used for numbers, and if the format included time formatting
but no date format, used "Time of Day" format and multiplied the appropriate columns by 24. This
worked mostly fine as long as the input values were only times. But if the values included dates (not
shown in Excel only because of the selected format option), the displayed times in DPlot were correct, but
the underlying data was all fouled up with calendar dates multiplied by 24. This made it all but impossible
to add reference lines at the correct location, set the extents to the proper values, etc. In this
update to the Add-In, "Time of Day"
format will never be selected. Instead, "Date and Time" format is selected and the date formatting
string is set to "<none>". The updated Add-In is now included with the version 2.1.5.5
update. If you have already installed version 2.1.5.5 then you can get the Add-In update
here.
25 January, 2008
Version 2.1.5.5
- Changed the behavior of the
Force circular plots option for
polar plots. In previous versions the plot size was simply set to 6x6 inches, if the size had not previously
been specified. Six inches on many display monitors is a bit small. In this version if the size has not
been specified then it is set to roughly 80% of the minimum of the document window width and height. As in
previous versions, this size may be changed with the
Extents/Intervals/Size command on
the Options menu. If you do change the size using that command DPlot will force the width and height
to the smaller of those values.
- Modified the Playback feature to use the specified line
widths to draw curves, rather than forcing the line width to a single pixel as was done in all previous
versions for performance reasons. Performance has not suddenly improved, though, and for multiple data
sets you'll have better luck setting the line widths to 0 (a single pixel) before using Playback.
- Expanded the ColumnsAre macro/DDE
command to include support for 3D text files, and the ability to specify which columns to plot.
- Bug fix: When attempting to save a bitmap image (BMP, GIF, PNG, etc.) with a
FileSaveAs command, if the
document window was not maximized and the DPlot application window was minimized, DPlot
crashed. This was due to DPlot being confused about whether it was drawing to a bitmap for the display
window or for a saved image. Thanks Sven Henze for the help in isolating this problem.
- Added "Version" as a valid XTYP_REQUEST item. Version number is returned. To
use Version in an XTYP_REQUEST from Microsoft Excel, for example, you can type "=DPlot|System!Version"
in a blank cell. If using DPLOTLIB.DLL, the DPlot_GetVersion function is preferable as that function
distinguishes between the version of DPlot and DPlot Jr that will be started by a call to DPlot_Start or
other functions that launch DPlot, and DPlot_GetVersion doesn't require either DPlot or DPlot Jr to be
running.
- Added "LastCurveFit" as a valid XTYP_REQUEST item. The curve fit equation last
produced by the Polynomial Curve Fit
menu command or CurveFit macro/DDE
command is returned, formatted identically to the text shown on the Curve Fit Coefficients dialog box.
- Bug fix: The Z3=f(Z1,Z2) command
might have resulted in a crash if you had zoomed in on the Z1 surface at the time you ran that command.
20 January, 2008
Version 2.1.5.4
- The ERF function is more
accurate for small (< 1.E-7) values. ERF is used internally by the
CDF,
NORMDISTCDF, and
NORMINV functions. Previous versions used a polynomial
approximation that gave very accurate answers for x >> 1.E-7, but does not work well for smaller values. This
version uses the Maclaurin series erf(x) = 2/sqrt(pi) * (x - x^3/3 + x^5/10 - x^7/42 + x^9/216 + ...) for x < 1. This
series converges very quickly for small x and takes about 15 iterations for x near 1.
- The NORMINV function had a similar but different problem
for x < 5.E-7. NORMINV(x,0,1) is now very accurate for x > 1.E-14.
- Bug fix: The Check for Updates feature on the Help menu did not work properly for university subscribers in
the third year of a 3-year subscription.
- Bug fix: For point labels containing $YMAX, $YMIN, and similar shortcuts, DPlot confused that shortcut with
$Y (the value at the referenced point). This generally resulted in the wrong label text, which might have
grown longer each time the plot was redrawn for any reason.
12 January, 2008
Version 2.1.5.3
- Continued with version 2.1.5.1's changes to how Wingding symbols are handled. Most (though not all) characters
with a hollow interior will now be filled with the window background color.
- Data processing mode now allows a choice of time units. Previous versions were limited to milliseconds.
- Added "Assume input dates are of the form d/m/y" option to the General Options dialog. If
unchecked DPlot behaves as in all previous versions: dates from text boxes, the clipboard, or a file are
assumed to be in the order m/d/y unless one of the first 2 fields is greater than 1000, if the assumed
date field is greater than 12, or if any of the fields is non-numeric, e.g. "Feb". If this option
is checked, dates are assumed to be in the order d/m/y unless, again, one of the above conditions is matched.
- For bar charts with amplitude or percentage labels, if "Labels outside bars" is checked then the
labels will be drawn with a transparent background. In previous versions the labels were opaque.
- Bug fix: On XY plots with "Grid Lines or Box" set to "Axes Only" and "Arrowheads"
turned off, an uninitialized data problem might have caused DPlot to crash when copying a plot to the clipboard.
- Bug fix: With acceleration plots in data processing mode it was not possible to use the right-click menu to
change the line style, symbol parameters, or color of the velocity or displacement plots.
4 January, 2008
Version 2.1.5.1
- Amended the way that the new Wingding symbol capability is implemented. For many characters with hollow interiors
(primarily round, square, or diamond-shaped glyphs), DPlot will now first draw another solid character with the
same shape but using the window background color so that the interiors of these symbols are opaque.
- Changed the ZGrid function in the Excel Add-In such that if the Y rows and X columns are evenly-spaced, the
data is passed to DPlot as points on a rectangular grid rather than random 3D points. The latter plot type
is generally superior for the same data because the rendering is not so dependent on how the mesh is divided
into triangles.
- Bug fix: The Generate Mesh menu command sometimes had serious (as in crashing) problems with very
rough/random data.
- Bug fix: Recent change to the DPlot_AddData function allowing a NULL pointer for X was
poorly implemented and might have fouled up with all calls for XY plots, with or without a NULL X.
1 January, 2008
Version 2.1.5.0
- Added Mercator Projection scaling for XY plots.
- Added ArcView Shapefile file import plugin.
- Symbols, symbols, and more symbols. Two symbols have been added to the 38 previously available graphic symbols, and
you may now use characters from the Wingdings, Wingdings 2, or Wingdings 3 fonts (assuming those fonts are installed).
- If Fill Between Curves is used to fill in the area formed by closing the first curve (in other words,
the 2nd curve is set to "None"), then DPlot now checks against Y values lying outside limits
set with Amplitude Limits and breaks the fill up into multiple segments if necessary. This is
particularly useful for filling in, for example, maps
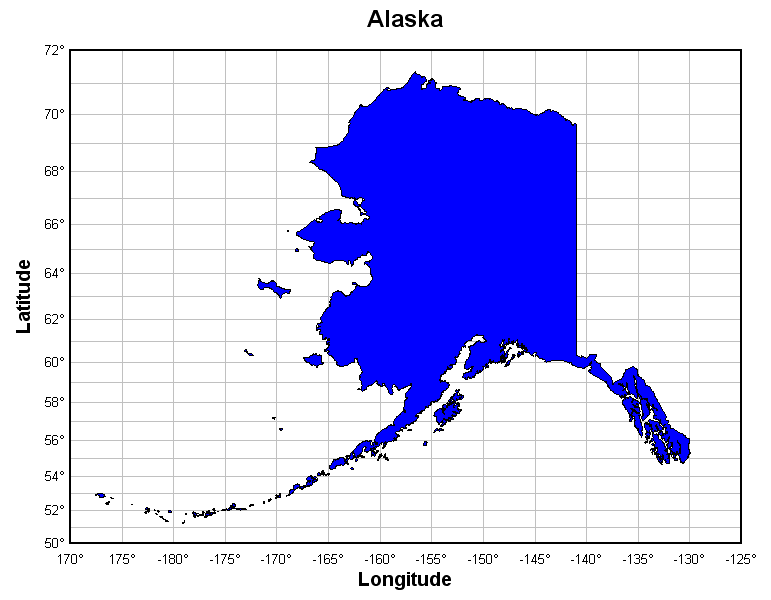
imported with the ArcView Shapefile plugin. (In the example, the boundary of Alaska is one continuous curve.)
- Polar charts may now have a reversed amplitude axis, with the maximum value at the center of the plot. This may
be handy for (for example), global maps.
- Added a wireframe option to 3D plots.
- Text notations may now be oriented vertically.
- Vector plots may now be drawn w/o an arrowhead by setting the arrow height to 0. (In previous versions a 0 arrow height
forced the default height of 0.15"). Also added an option to center vectors on the data point; the default is to
draw vectors with the tail at the point.
- Added $SUMX and $SUMY text shortcuts for XY plots, which will be replaced with the sum of all X/Y coordinates for the
given curve when a plot is drawn.
- Added PMT function to the function parser, for use in Y=f(X) and similar commands.
This function returns the payment for a loan based on constant payments and a constant interest rate.
- In previous versions for tripartite plots the displacement grid lines and labels were drawn in a single pass, followed
by the acceleration grid lines and labels. This resulted in acceleration grid lines overwriting displacement labels
(which might not have been noticeable with thin grid lines and/or a small font). In this version grid lines are drawn
in both directions, followed by labels for both directions.
- Added "Use settings for current plot" option to the Excel Add-In. If checked and a new plot produced by
the Add-In is of the same type as the currently active plot in DPlot (XY, 3D, etc.), then preferences from the active
plot (line styles, colors, etc.) will be used in the new plot.
- Bug fix: Recent change of allowing point-click addition of new data points in an empty plot caused a crash due to the
extents being uninitialized if a logarithmic scale was used on either the X or Y axis.
- Bug fix: Previous versions under Windows 2000 might have crashed when using the Search feature in the Help file.
In this release the Help works identically to Windows 95 and 98, by launching KEYHH to display Help rather than
relying on the Windows API. Search now causes no problems, but context-sensitive help within dialog boxes has
been disabled. Context-sensitive help remains in place for Windows XP and Vista.
- Bug fix: Corrected a couple of problems with the Reorder Curves feature: In previous versions bubble plot
source curves and vector angle and magnitude source curves were omitted from the list. This made it less than obvious
where a curve would end up in the order of all curves. DPlot also now correctly transfers all bubble plot and vector
plot settings with a curve as you move it up or down in the list.
- Amended the behavior of the DPlot_AddData function. For XY plots if the *array1
argument (the address of an X array) is NULL, then X values will be generated within DPlot, with the value equal to
the 0-based index of each point.
- Added SavePreferences macro/DDE command.
2007 2009
|
RUNS ON
Windows 10,
Windows 8,
Windows 7, 2008,
Vista, XP, NT,
ME, 2003, 2000,
Windows 98, 95
|
|