March 2010 Archives

Square root symbol in text

From support e-mail:

Q: I was wondering if there is any way in DPlot to put a square root in axis labels? What i am looking for is...say like..."sqrt(t)" but with the "real" square root symbol.

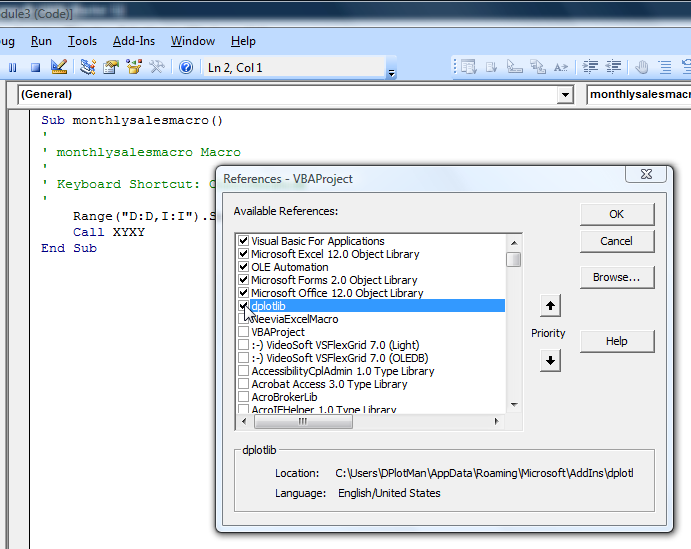
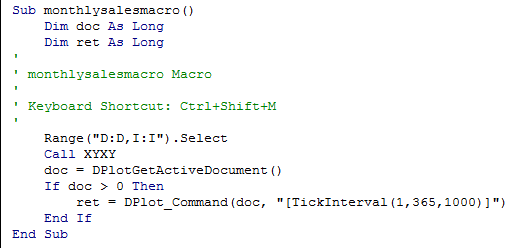
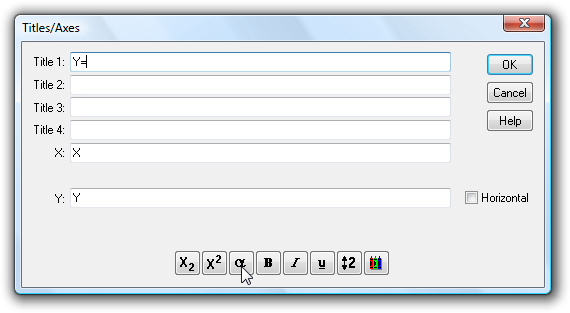
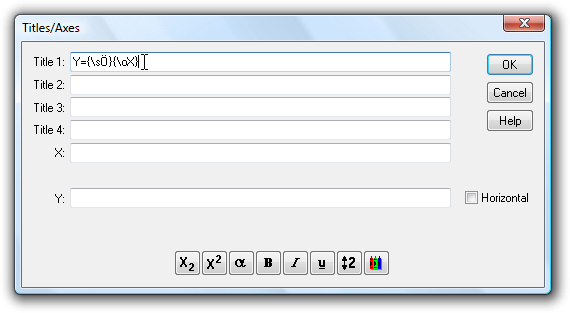
A: Yes there is, if you are willing to experiment just a bit. Select the Title/Axes command on the Text menu. (This also works with the legend and with point labels and text notations). Click within the text box where you want the square root symbol, then click the α button at the bottom of the dialog box:

Now select the left portion of the square root symbol in the next-to-last row, towards the right:

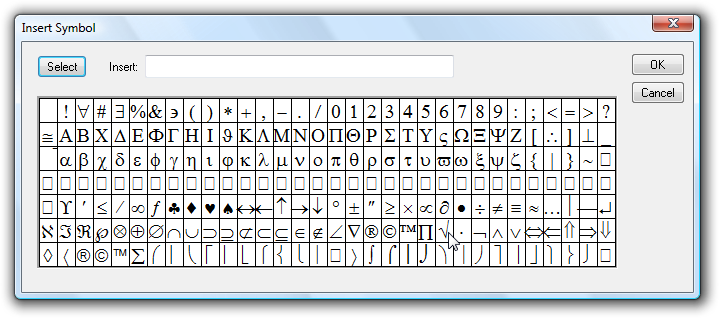
click the Select button, then OK.

For the horizontal bar, the best you can do is an overbar code. This draws a horizontal line above the character(s) that have this attribute. But there is no button on the Title/Axes (or any other) dialog for the overbar code, so you'll need to type it yourself:

Where this all becomes a trial-and-error process is that the overbar is not specifically designed to line up perfectly with the left end of the square root symbol. With some font sizes and weights it appears to be perfect, but with others... it isn't all that good. And the results will vary by output device. Generally if it looks good on the screen it will look good in saved bitmap images or printed out, but may or may not be aligned properly in metafiles. The alignment will vary with font face (Arial tends to work well), and smaller fonts (12-16 pt) tend to do better than larger fonts. Bold fonts definitely do better. But as mentioned at the outset, you'll have to experiment. Here's a 14-pt bold Arial stab at the problem:

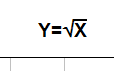
Unfortunately this feature does not work at all with subscripts, superscripts, etc., as the overbar will be at varying heights above the baseline. Perhaps a future release will address this problem with a sqrt formatting code.

For a list of all formatting codes see the online Help topic for the Title/Axes command, or within DPlot click the Help button on the Title/Axes dialog box.

Calling Excel Add-In functions from a Macro

From support mail:

Q: I have done quite a bit with your Macro language. However, I have a question about your Excel Add-In. Do you know how I could call it from an Excel Macro? I tried recording a Macro and calling your Add-In, but it didn't show in the code when I was done.

A: Unfortunately Excel doesn't record calls to Add-In functions when recording a macro using keystrokes/button presses. But the fix is simple enough: Go through your normal steps in your macro recording just before you call XYXY or XYYY or whatever. Stop recording. For Excel 2007 or 2010 select the Developer tab, click Macros, select your macro, then click Edit. On Excel 2003 select Tools>Addins>Macros>select macro>Edit. At the end of the macro add a new line with

Call XYYY ' or whatever

And one final step: in the VBA window select Tools>References and check dplotlib.

If you are prompted for a password for the dplotlib entry on this screen, it is "dplot", without the quotation marks.

Edit: Starting with the Add-In distributed with v2.2.8.1 on March 9, 2010 you have access to several Add-In functions that were previously marked "private" and so were inaccessible to your macros. Namely DPlotGetActiveDocument, DPlot_Command, and DPlot_Request. How is this useful? If the default values for scaling, fonts, tick mark intervals, plot size, or whatever set by Add-In functions are not to your liking, you can control just about any aspect of the plot with a call to DPlot_Command, as in the following:

To call DPlot_Command or DPlot_Request you need the index of the currently active document (XYYY and other Add-In commands activate the plots that they create). That's where DPlotGetActiveDocument comes in. The DPlot_Command call in this case sets the tick mark interval to 365 (days, in this case) on the X axis and $1000 on the Y axis. For a rather lengthy list of all available DPlot_Command commands, see the Help file topic.

Important Edit:
When finished with calling any DPlot functions in your macro, if you have called DPlot_Command or DPlot_Request, you should disconnect from the currently active DDE conversation. Otherwise the plot will work as expected, but certain mouse operations (e.g. displaying coordinates while moving your mouse across the plot) will not work as expected, as DPlot will think there is still an active DDE conversation and responding to those actions is not appropriate. Disconnecting from a conversation can be accomplished simply with:

Call DPlot_Finish(doc)

About this Archive

This page is an archive of entries from March 2010 listed from newest to oldest.

November 2009 is the previous archive.

May 2010 is the next archive.

Find recent content on the main index or look in the archives to find all content.

Categories

Pages

Powered by Movable Type 4.25