<?xml version="1.0" encoding="utf-8"?>
<feed xmlns="http://www.w3.org/2005/Atom">
    <title>DPlot</title>
    <link rel="alternate" type="text/html" href="http://www.dplot.com/blog/" />
    <link rel="self" type="application/atom+xml" href="http://www.dplot.com/blog/atom.xml" />
    <id>tag:www.dplot.com,2009-04-09:/blog//1</id>
    <updated>2010-05-11T00:47:08Z</updated>
    <subtitle><![CDATA[DPlot Graph Software for Scientists &amp; Engineers]]></subtitle>
    <generator uri="http://www.sixapart.com/movabletype/">Movable Type 4.25</generator>

<entry>
    <title>Background images</title>
    <link rel="alternate" type="text/html" href="http://www.dplot.com/blog/2010/05/background-images.html" />
    <id>tag:www.dplot.com,2010:/blog//1.15</id>

    <published>2010-05-11T00:29:14Z</published>
    <updated>2010-05-11T00:47:08Z</updated>

    <summary>From the forums: 1) I need to plot pollutant concentration contours on an aerial image. I have been evaluating dPlot and it can accept data from my dispersion modeling program. So dPlot does most of what I want except for...</summary>
    <author>
        <name>David Hyde</name>
        
    </author>
    
    
    <content type="html" xml:lang="en-US" xml:base="http://www.dplot.com/blog/">
        <![CDATA[<p>From the <a href="http://www.dplot.com/forums/index.php">forums</a>:</p>

<p>1) I need to plot pollutant concentration contours on an aerial image. </p>

<p>I have been evaluating dPlot and it can accept data from my dispersion modeling program. So dPlot does most of what I want except for the final step of applying a 'base map' so that the contours appear overlaid on a background aerial image.</p>

<p>Photoshop can combine two jpgs, but I would prefer it if there was a way to do it within dPlot so I don't need Photoshop.</p>

<p>and...</p>

<p>2) I am evaluating the capability of DPlot for my application. Overall, this is the great software with this price. I am going to buy it anyway. 
My application requires the background image(s) -- layer(s) of PCBA drawings, and foreground with a 3D Contour (rainbow colored) graphic shows the NFE (Near Field Emission) level. The foreground should be able to Alpha-blend with background image.</p>

<p>This can be done with another application (like Visio), but needs additional steps. It will be a great feature if this can be done in DPlot application.</p>

<hr>

<p>Starting with version 2.2.8.8, either can be done. You can specify an image that will be drawn either in the foreground or background, with a specified transparency level and optionally a background color that will not be drawn. In addition, the alpha channel in 32-bit PNG files and the transparent color (if any) in 8-bit GIF or PNG images is respected.</p>

<p>1) The first example is a latitude-longitude recording of a Garmin GPS device overlaid on a Google Earth image:</p>

<p><img src="http://www.dplot.com/examples/garmin_bg.png" /></p>

<p>2) The following image is a surface plot with an overlaid JPG schematic drawn with a transparency value of 50 (0=invisible, 255=opaque):</p>

<p><img src="http://www.dplot.com/examples/background_pcb.png" /></p>

<p>For more information see the <a href="http://www.dplot.com/help/index.htm?helpid_background_image.htm">Background Image</a> topic in the online manual or the corresponding entry in the Help file.</p>]]>
        
    </content>
</entry>

<entry>
    <title>Square root symbol in text</title>
    <link rel="alternate" type="text/html" href="http://www.dplot.com/blog/2010/03/square-root-symbol-in-text.html" />
    <id>tag:www.dplot.com,2010:/blog//1.14</id>

    <published>2010-03-27T17:36:41Z</published>
    <updated>2010-03-28T01:22:18Z</updated>

    <summary>From support e-mail: Q: I was wondering if there is any way in DPlot to put a square root in axis labels? What i am looking for is...say like...&quot;sqrt(t)&quot; but with the &quot;real&quot; square root symbol. A: Yes there is,...</summary>
    <author>
        <name>David Hyde</name>
        
    </author>
    
    <category term="squareroot" label="square root" scheme="http://www.sixapart.com/ns/types#tag" />
    
    <content type="html" xml:lang="en-US" xml:base="http://www.dplot.com/blog/">
        <![CDATA[From support e-mail:

<p><b>Q:</b> I was wondering if there is any way in DPlot to put a square root in  
axis labels? What i am looking for is...say like..."sqrt(t)" but with the "real" square root symbol.</p>

<p><b>A:</b> Yes there is, if you are willing to experiment just a bit. Select the Title/Axes command on the Text menu. (This also works with the legend and with point labels and text notations). Click within the text box where you want the square root symbol, then click the α button at the bottom of the dialog box:</p>

<p><img src="http://www.dplot.com/blog/images/sqrt1.png" /></p>

<p>Now select the left portion of the square root symbol in the next-to-last row, towards the right:</p>

<p><img src="http://www.dplot.com/blog/images/sqrt2.png" /></p>

<p>click the Select button, then OK.</p>

<p>For the horizontal bar, the best you can do is an overbar code. This draws a horizontal line above the character(s) that have this attribute. But there is no button on the Title/Axes (or any other) dialog for the overbar code, so you'll need to type it yourself:</p>

<p><img src="http://www.dplot.com/blog/images/sqrt3.png" /></p>

<p>Where this all becomes a trial-and-error process is that the overbar is not specifically designed to line up perfectly with the left end of the square root symbol. With some font sizes and weights it appears to be perfect, but with others... it isn't all that good. And the results will vary by output device. Generally if it looks good on the screen it will look good in saved bitmap images or printed out, but may or may not be aligned properly in metafiles. The alignment will vary with font face (Arial tends to work well), and smaller fonts (12-16 pt) tend to do better than larger fonts. Bold fonts definitely do better. But as mentioned at the outset, you'll have to experiment. Here's a 14-pt bold Arial stab at the problem:</p>

<p><img src="http://www.dplot.com/blog/images/sqrt4.png" /></p>

<p>Unfortunately this feature does not work at <strong>all</strong> with subscripts, superscripts, etc., as the overbar will be at varying heights above the baseline. Perhaps a future release will address this problem with a sqrt formatting code.</p>

<p>For a list of all formatting codes see the <a href="http://www.dplot.com/help/index.htm?helpid_titles.htm">online Help</a> topic for the Title/Axes command, or within DPlot click the Help button on the Title/Axes dialog box.</p>]]>
        
    </content>
</entry>

<entry>
    <title>Calling Excel Add-In functions from a Macro</title>
    <link rel="alternate" type="text/html" href="http://www.dplot.com/blog/2010/03/calling-excel-add-in-functions-from-a-macro.html" />
    <id>tag:www.dplot.com,2010:/blog//1.13</id>

    <published>2010-03-06T21:41:20Z</published>
    <updated>2010-06-30T23:06:04Z</updated>

    <summary>From support mail: Q: I have done quite a bit with your Macro language. However, I have a question about your Excel Add-In. Do you know how I could call it from an Excel Macro? I tried recording a Macro...</summary>
    <author>
        <name>David Hyde</name>
        
    </author>
    
    <category term="addin" label="Add-In" scheme="http://www.sixapart.com/ns/types#tag" />
    <category term="macro" label="macro" scheme="http://www.sixapart.com/ns/types#tag" />
    
    <content type="html" xml:lang="en-US" xml:base="http://www.dplot.com/blog/">
        <![CDATA[<em>From support mail:</em>
<p><strong>Q:</strong> I have done quite a bit with your Macro language.  However, I have a question about your Excel Add-In.  Do you know how I could call it from an Excel Macro?  I tried recording a Macro and calling your Add-In, but it didn't show in the code when I was done.

</p><p><strong>A:</strong> Unfortunately Excel doesn't record calls to Add-In functions when recording a macro using keystrokes/button presses. But the fix is simple enough: Go through your normal steps in your macro recording just before you call XYXY or XYYY or whatever. Stop recording. For Excel 2007 or 2010 select the Developer tab, click Macros, select your macro, then click Edit. On Excel 2003 select Tools&gt;Addins&gt;Macros&gt;select macro&gt;Edit. At the end of the macro add a new line with
 
</p><p>Call XYYY ' or whatever
 
</p><p>And one final step: in the VBA window select Tools&gt;References and check dplotlib.
 
</p><p><img src="http://www.dplot.com/blog/images/call_dplotlib_from_macro.png" /></p>

<p>If you are prompted for a password for the dplotlib entry on this screen, it is "dplot", without the quotation marks.</p>

<p><b>Edit</b>: Starting with the Add-In distributed with v2.2.8.1 on March 9, 2010 you have access to several Add-In functions that were previously marked "private" and so were inaccessible to your macros. Namely DPlotGetActiveDocument, DPlot_Command, and DPlot_Request. How is this useful? If the default values for scaling, fonts, tick mark intervals, plot size, or whatever set by Add-In functions are not to your liking, you can control just about any aspect of the plot with a call to DPlot_Command, as in the following:

</p><p><img src="http://www.dplot.com/blog/images/macro_calling_dplotlib5.png" /></p>

<p>To call DPlot_Command or DPlot_Request you need the index of the currently active document (XYYY and other Add-In commands activate the plots that they create). That's where DPlotGetActiveDocument comes in. The DPlot_Command call in this case sets the tick mark interval to 365 (days, in this case) on the X axis and $1000 on the Y axis. For a rather lengthy list of all available DPlot_Command commands, see <a href="http://www.dplot.com/help/index.htm?helpid_prog_xtyp_execute.htm">the Help file topic.</a></p>

<p><b><u>Important Edit:</u></b><br />
When finished with calling any DPlot functions in your macro, <b>if</b> you have called DPlot_Command or DPlot_Request, you should disconnect from the currently active DDE conversation. Otherwise the plot will work as expected, but certain mouse operations (e.g. displaying coordinates while moving your mouse across the plot) will <b>not</b> work as expected, as DPlot will think there is still an active DDE conversation and responding to those actions is not appropriate. Disconnecting from a conversation can be accomplished simply with:</p>

<p><code>Call DPlot_Finish(doc)</code></p>]]>
        
    </content>
</entry>

<entry>
    <title>Moving Average</title>
    <link rel="alternate" type="text/html" href="http://www.dplot.com/blog/2009/11/moving-average.html" />
    <id>tag:www.dplot.com,2009:/blog//1.12</id>

    <published>2009-11-04T01:48:39Z</published>
    <updated>2009-11-08T15:40:32Z</updated>

    <summary>Adapted from the Forums: Q: I need to know what mathematical algorithm is used for the moving average calculations. Normally, a moving average will require that the &quot;end regions&quot; of the graph not be included in the graph of the...</summary>
    <author>
        <name>David Hyde</name>
        
    </author>
    
    <category term="movingaverage" label="Moving average" scheme="http://www.sixapart.com/ns/types#tag" />
    
    <content type="html" xml:lang="en-US" xml:base="http://www.dplot.com/blog/">
        <![CDATA[<em>Adapted from the <a href="http://www.dplot.com/forums">Forums:</a></em>

<p><b>Q:</b> I need to know what mathematical algorithm is used for the moving average calculations. </p>

<p>Normally, a moving average will require that the "end regions" of the graph not be included in the graph of the moving average, since, for example, a centered 11-day moving average can't provide data for the first 5 days and therefore can't be graphed. The same is true of the last 5 days in this example. I believe this problem is inherent in all moving average calculation varieties (though I'm open to being educated). </p>

<p>I bring it up because graphing the end-point regions of a moving average generates quite a bit of controversy in the climate sciences where I work because the end regions normally excluded in a moving average have to be filled in based on some sort of (often unscientific) assumption--even a simple "continue the trend" assumption. </p>

<p><b>A:</b> For versions 2.2.7.0 and earlier, the output of the Moving Average plugin is an average of the last N points, where N is the interval chosen. This is identical to the Moving Average function of Excel's Analysis ToolPak, with the exception that Excel gives "#N/A" for the first N-1 points, while the DPlot plugin gives the average of i points for i&lt;N.</p>

<p>The new version of the Moving Average plugin includes three forms, two of them new: 1) <em>Prior Moving Average</em> (identical to the only previous option), 2) <em>Central Moving Average</em> (more like what you're talking about, with point i equal to the average of points i-(N-1)/2 through i+(N-1)/2, and 3) <em>Cumulative Moving Average</em>, which is the average of all points up to and including the i'th point.</p>

<p>In addition, the new plugin allows you to include (or not) points at the tails of your data. If <em>Include tails</em> is checked, then as before the i'th point for i&lt;N is the average of the first i points for a <em>Prior Moving Average</em>. Similarly, for a <em>Central Moving Average</em> and i&lt;(N+1)/2 or greater than NP-(N-1)/2 (where NP is the number of points in the input), the output is the average of the sampled input points. If <em>Include tails</em> is <b>not</b> checked, then the output will only include points for which i<u>&gt;</u>N for a <em>Prior Moving Average</em>, or i<u>&gt;</u>(N-1)/2 and i<u>&lt;</u>NP-(N-1)/2 for a <em>Central Moving Average</em>.

</p><p>
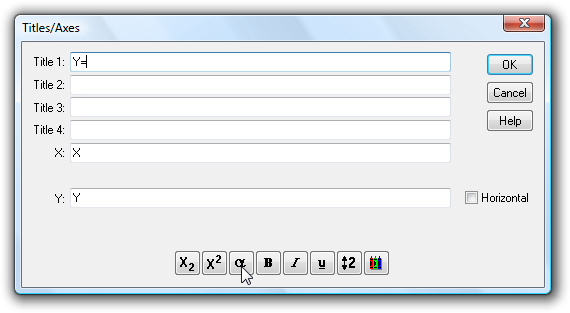
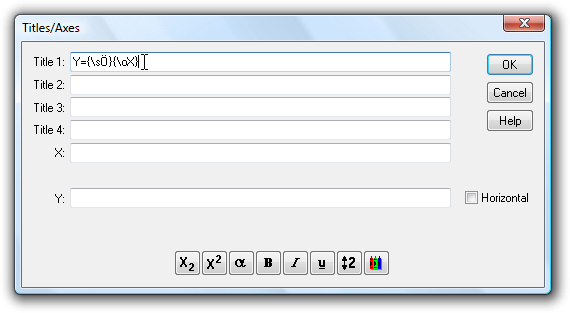
The new input dialog for the Moving Average plugin (licensed version only):</p>

<p><img src="http://www.dplot.com/forumimages/moving_average_dialog.png" /></p>

<p>Which method is appropriate for your use is dependent on what you are measuring. The <em>Prior Moving Average</em> is a well-established standard but for data that tends to increase or decrease over time, introduces a lag in the output: for a steadily increasing record the output will tend to be equal to the input N/2 measurements ago. The <em>Central Moving Average</em> eliminates this lag but may not be appropriate for your use if the current prediction should not be influenced by future data. The <em>Cumulative Moving Average</em> is mostly useful for data that doesn't increase/decrease monotonically over time and for which early data is significant for the present.</p>

<p>The new plugin is included with the 2.2.7.3 release of DPlot. Licensed users who are not on the update mailing list can get this version by selecting the <em>Check for Updates</em> command on the Help menu.</p>

<p>Example (with <em>Include tails</em> checked in all cases):</p>

<p><img src="http://www.dplot.com/blog/images/moving_average.png" /></p>]]>
        
    </content>
</entry>

<entry>
    <title>Help! DPlot&apos;s Help doesn&apos;t work!</title>
    <link rel="alternate" type="text/html" href="http://www.dplot.com/blog/2009/08/help-dplots-help-doesnt-work.html" />
    <id>tag:www.dplot.com,2009:/blog//1.11</id>

    <published>2009-08-14T23:35:36Z</published>
    <updated>2009-10-25T23:08:17Z</updated>

    <summary><![CDATA[In case you missed the recent addition to the FAQ and are having trouble with DPlot's Help: When selecting Help&gt;Contents in DPlot if you see a screen like this: ...then you almost certainly have DPlot installed on a network server...]]></summary>
    <author>
        <name>David Hyde</name>
        
    </author>
    
    <category term="help" label="help" scheme="http://www.sixapart.com/ns/types#tag" />
    
    <content type="html" xml:lang="en-US" xml:base="http://www.dplot.com/blog/">
        <![CDATA[<p>In case you missed the recent addition to the <a href="http://www.dplot.com/faq.htm">FAQ</a> and are having trouble with DPlot's Help:

</p><p>When selecting Help&gt;Contents in DPlot if you see a screen like this:
</p><p><img src="/blog/images/networkhelp.png" alt="" width="661" height="374" />
</p><p>...then you almost certainly have DPlot installed on a network server and are running DPlot from a client system. Although the program will run fine in this configuration, the Help file will not. Unfortunately this is a Windows security "feature" introduced with a security patch for Windows XP, also affecting all Vista versions. If you are <b>certain</b> that you will not be viewing any "untrusted" CHM Help files then the good folks at EC Software have provided 
<a href="http://www.ec-software.com/products_hhreg.html" target="_blank">a fix</a>. Otherwise, your best bet is to install DPlot to all client machines rather than running from a server.
</p>]]>
        
    </content>
</entry>

<entry>
    <title>Text Placeholders</title>
    <link rel="alternate" type="text/html" href="http://www.dplot.com/blog/2009/08/text-placeholders.html" />
    <id>tag:www.dplot.com,2009:/blog//1.10</id>

    <published>2009-08-14T01:28:21Z</published>
    <updated>2009-08-14T23:35:12Z</updated>

    <summary><![CDATA[ A frequent support question is along the lines of "How do I automatically display the &lt;min, max, mean, std. deviation, etc.&gt; of a curve in a &lt;title line, axis label, legend entry, note, etc.&gt;"? Text placeholders have been available...]]></summary>
    <author>
        <name>David Hyde</name>
        
    </author>
    
    <category term="textplaceholders" label="text placeholders" scheme="http://www.sixapart.com/ns/types#tag" />
    
    <content type="html" xml:lang="en-US" xml:base="http://www.dplot.com/blog/">
        <![CDATA[ <p>A frequent support question is along the lines of "How do I automatically display the &lt;min, max, mean, std. deviation, etc.&gt; of a curve in a &lt;title line, axis label, legend entry, note, etc.&gt;"? <a href="http://www.dplot.com/help/index.htm?helpid_text_shortcuts.htm">Text placeholders</a> have been available for a long while, but for whatever reason aren't noticed by many users. You'll probably find all the information you need in the linked Help topic, but this post will walk through an example of how this feature can be used. In the example below we'll work with a <a href="http://www.dplot.com/help/index.htm?helpid_bubbles.htm">bubble plot</a> because it has at least one oddity that isn't the case for most other plot types.

</p><p><img src="http://www.dplot.com/blog/images/textplaceholders_a.png" width="554" height="599" />

</p><p>The particulars of this graph aren't really important in this case. The data consists of two "curves"; the bubble magnitudes come from the second curve. The rainfall rate values (bubble magnitudes) vary from ~2.1 - ~11.7. The user in this case wanted to display the rainfall rates in the legend entry for the plot. It would of course be easy enough to type those values for the legend, but we'd like something a bit more automatic that can be stored in a preferences file and/or set in a macro to get the same results for other data. If the legend entry is set to:

</p><p><code>$YMIN(2) - $YMAX(2) inches/hr</code>

</p><p>...then the result looks something like:

</p><p><img src="http://www.dplot.com/blog/images/textplaceholders_b.png" width="554" height="599" />

</p><p>The (2) index references the 2<sup>nd</sup> curve (the bubble magnitudes). If the (2) were not included, then the legend would use the minimum and maximum values of the "Runoff" curve. 

</p><p>This is fine, but displays more significant figures than we'd like. Text placeholders can include an equation, and the equation itself can contain other text placeholders. So we can use the <a href="http://www.dplot.com/help/index.htm?mround.htm">MROUND</a> function:

</p><p><code>$=(MROUND($YMIN(2),0.1)) - $=(MROUND($YMAX(2),0.1)) inches/hr</code>

</p><p>... to round off the rainfall rate values to the nearest 0.1, and get:

</p><p><img src="http://www.dplot.com/blog/images/textplaceholders_c.png" width="554" height="599" />

</p><p>Questions? <a href="mailto:support@dplot.com">Let us know.</a>

</p>]]>
        
    </content>
</entry>

<entry>
    <title>Plot overlays</title>
    <link rel="alternate" type="text/html" href="http://www.dplot.com/blog/2009/07/plot-overlays.html" />
    <id>tag:dplot.com,2009:/blog//1.9</id>

    <published>2009-07-18T05:45:23Z</published>
    <updated>2010-01-27T18:15:21Z</updated>

    <summary>A frequent question in support e-mails is related to overlaying a plot with another, particularly for different plot types, e.g. overlaying a 3D surface plot with an XY plot. This feature has been a long time in making and still...</summary>
    <author>
        <name>David Hyde</name>
        
    </author>
    
    <category term="overlay" label="overlay" scheme="http://www.sixapart.com/ns/types#tag" />
    
    <content type="html" xml:lang="en-US" xml:base="http://www.dplot.com/blog/">
        <![CDATA[<p>A frequent question in support e-mails is related to overlaying a plot with another, particularly for different plot types, e.g. overlaying a 3D surface plot with an XY plot. This feature has been a long time in making and still has a few issues (see below), but <strong>yes you can</strong> do this with the OverlayDocument macro command or, if you're a developer, by sending the OverlayDocument command to DPlot via the <a href="http://www.dplot.com/lib/index.htm?dplot_command.htm">DPlot_Command</a> function in dplotlib.dll. This feature is only available in DPlot versions 2.2 and later.

</p><p>Syntax:<br />
<strong>OverlayDocument(<em>docnum</em>|,<em>alpha</em>|<em>maskcolor</em>||)</strong> or<br />
<strong>OverlayDocument("<em>caption</em>"|,<em>alpha</em>|,<em>maskcolor</em>||)</strong>

</p><p>In the first form, <strong><em>docnum</em></strong> is the 1-based document index of the plot you want to draw on top of the currently active plot. This value corresponds to the indices you'll see for open documents on the Window menu.

</p><p>In the second form, <strong>"<em>caption</em>"</strong> is the title of that plot, shown in the document title bar. If this form is used then the caption must be delineated with quotation marks, as shown.

</p><p>The optional <strong><em>alpha</em></strong> parameter controls the transparency of the overlay. <strong><em>alpha</em></strong>=0 is completely transparent (invisible, in other words); <strong><em>alpha</em></strong>=255 is opaque (no transparency).

</p><p>The <strong><em>maskcolor</em></strong> argument specifies a color (red+green*256+blue*65536, or hex 0x00bbggrr) in the overlay that will not be drawn if <strong><em>alpha</em></strong> is between 0 and 255. This is useful for making opaque portions of the overlay transparent: in particular an opaque legend box or contour line labels with an opaque background. This feature does not work particularly well with anti-aliased lines and/or smoothed screen fonts, since you can only specify a single color. Antialiased lines and fonts are generally less of a problem with printed plots.

</p><p>If you aren't familiar with DPlot macros, there really isn't all that much to it, so don't be scared off just yet. To create a macro select the Macro command on the File menu. Type a name for the macro that you'll remember next week in the <em>Macro Name</em> box, then click <em>Edit/Create</em>. We'll start with something simple: if you have 2 open documents, document 1 is active and you want to overlay it with document 2, type:

</p><p><strong>OverlayDocument(2)</strong>

</p><p>in the macro editor window, click the Save button, then the Run button.

</p><p><strong>Example:</strong>

</p><p>Document 1 is a surface plot of the Vicksburg National Military Park area created from NASA <a href="http://www.dplot.com/features.htm#SRTM">SRTM data:
</a></p>
<p><img src="http://www.dplot.com/blog/images/overlay01.png" height="627" width="669" />

</p><p>Document 2 is an XY plot created from a <a href="http://www.dplot.com/features.htm#GARMIN">Garmin GPS device</a> during a bike ride through that same park:
</p><p><img src="http://www.dplot.com/blog/images/overlay02.png" height="646" width="469" />

</p><p>With document 1 active, the macro command <strong>OverlayDocument(2)</strong> results in:
</p><p><img src="http://www.dplot.com/blog/images/overlay03.png" height="627" width="669" />

</p><p>This feature hasn't been added to the normal menu commands in DPlot simply because there are several quirks to work out yet. Namely: transparency may (or may not) work correctly in printed plots, depending on your printer. Multiple axes in the overlay plot are not transferred to the overlaid plot. Other than the data itself, most plot features for the overlay plot are ignored: title lines, axis labels, number formatting, etc. These are all necessary and won't likely change. But the legend for a surface plot is also omitted for (currently) the same reason, and there is no way to show that legend. At least some of these limitations will likely be worked out in a future release.

</p><p>This feature is <strong>not</strong> intended for use with 3D views of 3D/4D data at this time, though DPlot will not prevent you from using it on those plot types.


</p>]]>
        
    </content>
</entry>

<entry>
    <title>Offsetting a curve</title>
    <link rel="alternate" type="text/html" href="http://www.dplot.com/blog/2009/06/offseting-a-curve.html" />
    <id>tag:dplot.com,2009:/blog//1.8</id>

    <published>2009-06-18T23:47:41Z</published>
    <updated>2009-08-04T14:39:30Z</updated>

    <summary>From support e-mail: Q: I have created a log-prob curve and have fitted an equation to it that fits very nicely. Now I would like to create a parallel curve through another known data point How would I do this?...</summary>
    <author>
        <name>David Hyde</name>
        
    </author>
    
    
    <content type="html" xml:lang="en-US" xml:base="http://www.dplot.com/blog/">
        <![CDATA[<em>From support e-mail:</em> 
<p><strong>Q:</strong> I have created a log-prob curve and have fitted an equation to it that fits very nicely. Now I would like to create a parallel curve through another known data point How would I do this?</p>
<p><img src="http://www.dplot.com/blog/images/offsetcurve061809a.png" height="585" width="593" /> 
</p><p><strong>A:</strong> Nothing to it. You want your new curve to have the same shape (on this scale) as the original curve but offset by some value. So in your case the logarithms of the Y values in the new curve should all be proportional to the logarithms of the Y values in the original curve. First copy your curve fit to the Clipboard using <em>Edit&gt;Copy&gt;Data Values</em> and then paste using <em>Edit&gt;Paste</em> so that you have a copy of that curve and can preserve the original.</p>
<p>It's good in your case that you have a known offset between two points with the same X values. Otherwise this would take a smidgen more work. But basically, you want the same shape curve to pass through the point X=4%, Y=553, where the original passes through X=4%, Y=2697. So the new curve should be something like Y'=10^(log<sub>10</sub>Y + log<sub>10</sub>553 - log<sub>10</sub>2697. Remembering a bit of high school algebra, this reduces to Y'=Y*553/2697 (though either form will work). Use the <em>Operate on Y</em> command on the <em>Edit</em> menu on your pasted curve with Y=Y*553/2697 to get:</p>
<p><img src="http://www.dplot.com/blog/images/offsetcurve061809b.png" height="585" width="593" /></p>
<p>... which mimics the original curve fit with an offset in Y.</p>]]>
        
    </content>
</entry>

<entry>
    <title>Finding 0.2% offset strain</title>
    <link rel="alternate" type="text/html" href="http://www.dplot.com/blog/2009/06/finding-02-offset-strain.html" />
    <id>tag:dplot.com,2009:/blog//1.7</id>

    <published>2009-06-18T22:15:21Z</published>
    <updated>2010-01-27T20:22:15Z</updated>

    <summary>This one is intended mostly for folks who break things. Specifically, structural engineers who pull on steel (or other ductile metal) bars until they fail. From Wikipedia: Ductile metals do not have a well defined yield point. The yield strength...</summary>
    <author>
        <name>David Hyde</name>
        
    </author>
    
    <category term="stressstrain" label="stress-strain" scheme="http://www.sixapart.com/ns/types#tag" />
    
    <content type="html" xml:lang="en-US" xml:base="http://www.dplot.com/blog/">
        <![CDATA[This one is intended mostly for folks who break things. Specifically, structural engineers who pull on steel (or other ductile metal) bars until they fail. From <a href="http://en.wikipedia.org/wiki/Tensile_strength">Wikipedia</a>: 
<p></p>
<p><em>Ductile metals do not have a well defined yield point. The yield strength is typically defined by the "0.2% offset strain". The yield strength at 0.2% offset is determined by finding the intersection of the stress-strain curve with a line parallel to the initial slope of the curve and which intercepts the abscissa at 0.2%.</em></p>
<p>The question, then, is "Is there an easy way to determine the 0.2% offset strain line, without a calculator handy?" Yes, there is. Shown below is a typical stress-strain curve, in this case for a rolled steel bar.</p>
<p><img src="http://www.dplot.com/blog/images/offsetstrain1.png" height="573" width="634" /> 
</p>

<p>The first step is to find the slope of the elastic portion of the stress-strain curve. You can do that very easily with the <em>Distance from...</em> command on the <em>Info</em> menu. Ensure that <em>Snap cursor to nearest data point</em> is checked, then drag the mouse from a point near the origin along the initial (hopefully linear) slope:</p>
<p><img src="http://www.dplot.com/blog/images/offsetstrain2.png" height="574" width="637" /> 
</p>

<p>To avoid retyping (and transcription errors), drag your mouse over the "slope" value, right-click and select "Copy". Now select the <em>Y=f(X)</em> command on the <em>Generate</em> menu. The equation we want is simply (in this case) "21.6569856057*(x-2000)" (2000 microinches/inch = 0.2% strain). For the <em>from X</em> value use 2000 (or any smaller value); for <em>to X</em> use a strain value large enough that the line will be certain to cross the stress-strain curve. You can then zoom in if you overshoot the curve by a lot. The <em>with interval dX</em> entry isn't critical, since you'll be generating a straight line.</p>

<p>Finally, select <em>Find Intersections...</em> on the <em>Info</em> menu. (If this command is disabled you likely need to sort the data points with the <em>Sort</em> command on the <em>Edit</em> menu.) Check the <em>Insert data points...</em> and <em>Add labels at intersections</em> boxes, and you get: 

</p><p><img src="http://www.dplot.com/blog/images/offsetstrain3.png" height="573" width="634" /> 

</p><p>... indicating a yield stress of ~70.5ksi at a strain of ~0.005. </p>

<em>Thanks much to Stephen Rowell for his input on this one.</em>]]>
        
    </content>
</entry>

<entry>
    <title>Ternary plot options for rocks</title>
    <link rel="alternate" type="text/html" href="http://www.dplot.com/blog/2009/06/ternary-plot-options-for-rocks.html" />
    <id>tag:dplot.com,2009:/blog//1.6</id>

    <published>2009-06-04T16:17:20Z</published>
    <updated>2009-08-04T14:37:01Z</updated>

    <summary>From support e-mail: Q: I work with mineralogical data, some of which is used for rock classification. Is it possible to define field classification boundaries, other than those in the soil plot, so that rock classifications can be plotted? I...</summary>
    <author>
        <name>David Hyde</name>
        
    </author>
    
    <category term="maficrock" label="mafic rock" scheme="http://www.sixapart.com/ns/types#tag" />
    <category term="ternaryplot" label="ternary plot" scheme="http://www.sixapart.com/ns/types#tag" />
    <category term="triangleplot" label="triangle plot" scheme="http://www.sixapart.com/ns/types#tag" />
    <category term="ultramaficrock" label="ultramafic rock" scheme="http://www.sixapart.com/ns/types#tag" />
    
    <content type="html" xml:lang="en-US" xml:base="http://www.dplot.com/blog/">
        <![CDATA[<p><em>From support e-mail:</em></p>

<p><strong>Q:</strong> I work with mineralogical data, some of which is used for rock classification. Is it possible to define field classification boundaries, other than those in the soil plot, so that rock classifications can be plotted? I am using the standard IUGS rock classification diagrams for felsic, mafic and ultramafic rocks which are based on three minerals each. I have tried plotting field boundary coordinates in X-Y space and then selecting triangle plot, but the line disappears.</p>

<p><strong>A:</strong> In general you can plot any sort of boundaries and/or labels you want with a ternary plot (aka <em>triangle plot</em>, depending on what world you work in), and your "but the line disappears" is easily explained. But more on that below. First, <strong>yes you can</strong> plot <a href="http://www.dplot.com/triangle_plot.htm#MAFIC">mafic</a> and <a href="http://www.dplot.com/triangle_plot.htm#ULTRAMAFIC">ultramafic</a> rock classifications starting with version 2.2.6.</p>

<p>If the plot you have on the screen is <strong>not</strong> a triangle plot, first right-click on the graph and select <em>Triangle Plot</em> (or, equivalently, click on the Options menu, then <em>Linear/Log Scaling</em>, then <em>Triangle Plot</em>). Then right-click again on the plot and select <em>Triangle Plot Options</em> (again, the same option is available on the Options menu). You'll be presented (with version 2.2.6 or later) with this dialog box:</p>
<p><img src="http://www.dplot.com/blog/images/triplot_options.png" height="257" width="408" /></p>
<p>Select the appropriate options and click OK. For an ultramafic scale and blue boundary lines, you should now see something that looks a bit like this (minus your data):</p>
<p><img src="http://www.dplot.com/blog/images/ultramafic.png" height="517" width="719" /></p>
<p>As to the more general question, you can create whatever boundaries and labels you want, save those to a DPlot file, then later open that file and import and/or add that data to your file. Your "but the line disappears" comment is due to a default setting with regard to triangle plots. Take a look at the General command on the Options menu. Most likely the <em>Always force symbols on/lines off for triangle plots</em> option is checked. That option only applies to new data; you can either uncheck that option or later select the <em>Symbol/Line Styles</em> command on the Options menu to use a line style other than "None". </p>
<p>An example is always nice, so here is an example:</p>
<p>You want to show the boundaries for tuffs and ashes from R. Schmid's <em>Descriptive nomenclature and classification of pyroclastic deposits and fragments: Recommendations of the International Union of Geological Sciences Subcommission on the Systematics of Igneous Rocks.</em>. Yes, I know you don't really want that, but follow along anyway. The boundaries between the 3 regions will be created with normal DPlot "curves". The X,Y endpoints are: </p>
<p>(50,0) - (33.333333,33.333333),<br />(0,50) - (33.333333,33.333333), and<br />(50,50) - (33.333333,33.333333)<br />You can easily enter these points using the <em>Edit Data</em> command on the Edit menu.</p>
<p>Labels for the various regions are added with the <em>Add/Edit Note</em> command on the Text menu (or by clicking the Note button on the toolbar). You can either drag the notes to the desired location, or specify their location in terms of data space initially (no dragging required). The anchor point in data space for the notations shown below, with the justification set to Center and Middle in all cases, is:</p>
<p>vitric tuff\nvitric ash: 16.67, 66.67<br />crystal ash\ncrystal tuff: 16.67, 16.67<br />lithic tuff\nlithic ash: 66.67, 16.67</p>
<p>Once done your plot should resemble something like this:</p>
<p><img src="http://www.dplot.com/blog/images/schmid_tuff.png" height="515" width="571" /></p>
<p>Once this graph is created you can add your own data with the <em>Edit Data</em> command on the Edit menu or, if your data exists in a file, with the <em>Append</em> command on the File menu (as opposed to the <em>Open</em> command).</p>
<p>The DPlot file for this picture is available <a href="http://www.dplot.com/blog/dplotfiles/schmid_tuff.grf">here</a> (right-click and select <em>Save As</em>).</p>]]>
        
    </content>
</entry>

<entry>
    <title>Area enclosed by a polygon</title>
    <link rel="alternate" type="text/html" href="http://www.dplot.com/blog/2009/05/area-enclosed-by-a-polygon.html" />
    <id>tag:dplot.com,2009:/blog//1.5</id>

    <published>2009-05-13T16:55:19Z</published>
    <updated>2009-08-04T14:35:35Z</updated>

    <summary>From support e-mail: Q: Will DPLOT compute the area and or acreage within a closed plotted polygon? A: Yes. If you use the $AREA shortcut in any text entry (title lines, axis labels, legend, etc.) DPlot will report the area...</summary>
    <author>
        <name>David Hyde</name>
        
    </author>
    
    <category term="area" label="area" scheme="http://www.sixapart.com/ns/types#tag" />
    
    <content type="html" xml:lang="en-US" xml:base="http://www.dplot.com/blog/">
        <![CDATA[<p>From support e-mail:</p>
<p><strong>Q:</strong> Will DPLOT compute the area and or acreage within a closed plotted polygon?</p>
<p><strong>A:</strong> Yes. If you use the $AREA shortcut in any text entry (title lines, axis labels, legend, etc.) DPlot will report the area enclosed by your polygon. If the points are arranged in a clockwise direction the value will be positive; if counterclockwise the value will be negative. You can force a positive answer by using the absolute value operation, as in "Area=$=(ABS($AREA))". The initial "$=" tells DPlot an equation follows, which must be enclosed by parentheses.</p>
<p>If you have more than 1 curve then you'll need to use $AREA(n), where n is the 1-based index of the curve.</p>
<p>For most applications (and in particular since you asked about acreage) the value replacing $AREA is perfect. If you're trying to find the area enclosed by what should be a smooth curve, though, you might need to generate more points, if possible. The circle below was generated with X=f(t), Y=g(t) with X=2*cos(t), Y=2*sin(t) with the spacing in t set to 1 degree. The difference between the calculated area and the well-known area of a circle is due to the spacing between points.</p>
<p><img src="http://www.dplot.com/blog/images/area_05132009.png" height="550" width="564" /> </p>
<p>In case anybody is wondering, the plain text for that text note is:</p><pre>R	=2
Area	=$AREA
{\sp}r{\u2}	=$=(PI*4)</pre>
<p>with the tab stop set to 5 characters.</p>

<p>For more information see <a href="http://www.dplot.com/help/index.htm?how_area.htm">How do I find the area under a curve?</a> in the online manual.
</p>]]>
        
    </content>
</entry>

<entry>
    <title>Area between 2 curves</title>
    <link rel="alternate" type="text/html" href="http://www.dplot.com/blog/2009/05/area-between-2-curves.html" />
    <id>tag:dplot.com,2009:/blog//1.4</id>

    <published>2009-05-03T18:10:00Z</published>
    <updated>2009-05-03T20:53:08Z</updated>

    <summary>From support e-mail: Q: 1. Can DPlot find the area between two curves? Area under a curve? A:No and yes, mostly. You can embed the area under a curve in any text entry (title line, axis label, legend, etc.) with...</summary>
    <author>
        <name>David Hyde</name>
        
    </author>
    
    <category term="area" label="area" scheme="http://www.sixapart.com/ns/types#tag" />
    
    <content type="html" xml:lang="en-US" xml:base="http://www.dplot.com/blog/">
        <![CDATA[<p>From support e-mail:</p>

<p><strong>Q:</strong> 1. Can DPlot find the area between two curves? Area under a curve?</p>

<p><strong>A:</strong>No and yes, mostly. You can embed the area under a curve in any text entry (title line, axis label, legend, etc.) with $AREA(n), where n is the index of the curve.</p>

<p>Since you can embed equations in those same entries and also embed text 
shortcuts like $AREA in equations, you can indirectly report the area 
between two curves with something like "$=($AREA(1)-$AREA(2))". This will 
work fine as long as the curves don't cross. If they <strong>DO</strong> cross then you can get the area with a bit of manipulation: Use Generate>Y=f(X,Y1,Y2,...) with 
Y=abs(Y1-Y2) (to find the area between curves 1 and 2), then $AREA() on that new curve to find your answer.</p>

<strong>Q:</strong> 2.  Why is DPlot so much cheaper than other programs such as UniPlot or SigmaPlot?<p></p>

<p><strong>A:</strong> Good question :-). Both of those programs will do a few things DPlot will not. Whether that difference is worth 10+ times the price is something users will have to answer for themselves.</p>]]>
        
    </content>
</entry>

<entry>
    <title>Finding average Z value in a surface plot</title>
    <link rel="alternate" type="text/html" href="http://www.dplot.com/blog/2009/05/finding-average-z-value-in-a-surface-plot.html" />
    <id>tag:dplot.com,2009:/blog//1.3</id>

    <published>2009-05-02T22:06:56Z</published>
    <updated>2009-08-04T14:34:30Z</updated>

    <summary>From support e-mail: Q: DPLOT has been very helpful to me in producing Isolux curves from Excel data. The question is can I use DPLOT to compute the average lux within an area, or to integrate an area to directly...</summary>
    <author>
        <name>David Hyde</name>
        
    </author>
    
        <category term="Contour lines" scheme="http://www.sixapart.com/ns/types#category" />
    
    <category term="average" label="average" scheme="http://www.sixapart.com/ns/types#tag" />
    <category term="contourlines" label="contour lines" scheme="http://www.sixapart.com/ns/types#tag" />
    <category term="surfaceplots" label="surface plots" scheme="http://www.sixapart.com/ns/types#tag" />
    <category term="volume" label="volume" scheme="http://www.sixapart.com/ns/types#tag" />
    
    <content type="html" xml:lang="en-US" xml:base="http://www.dplot.com/blog/">
        <![CDATA[From support e-mail: 
<p><strong>Q:</strong> DPLOT has been very helpful to me in producing Isolux curves from Excel data. </p>
<p>The question is can I use DPLOT to compute the average lux within an area, or to integrate an area to directly compute the total lumen energy applied there? </p>
<p>Example: </p>
<p><img src="http://www.dplot.com/blog/images/zavg040209_1.png" height="635" width="647" /> </p>
<p><strong>A:</strong> DPlot has a couple of features that report the average magnitude for a surface plot (though neither of these is likely what you want). First, in the status bar DPlot shows the minimum, maximum, and average Z values <strong>for the displayed surface</strong>. (In other words if you zoom in or set the extents to different values, you'll likely see different values here.) </p>
<p><img src="http://www.dplot.com/blog/images/zavg040209_2.png" height="149" width="488" /> </p>
<p>The second method is to use the $MEAN shortcut in any text entry. Here we're using that shortcut in the 3rd title line: </p>
<p><img src="http://www.dplot.com/blog/images/zavg040209_3.png" height="281" width="538" /> </p>
<p>After clicking OK and turning on "Borders" and "Data points", you'll get this: </p>
<p><img src="http://www.dplot.com/blog/images/zavg040209_4.png" height="637" width="647" /> </p>
<p>Note the difference in average value displayed here and in the status bar (1.983469 vs. 3.458373). The difference is due to your original plot having the extents set to 0-50 in both X and Y, while the data goes out to X &amp; Y = 87 or so (and the points at X or Y &gt; 50 are all small magnitudes, which drives the $MEAN value down.) </p>
<p>"Borders" and "Draw points" have been turned on to illustrate the bigger problem with both of these "average" reports: The average (or $MEAN) is simply an average of all values with no consideration given to the spacing between points. Just guessing, but that's probably not what you want since every point has an equal weight in determining the "average" as every other point, regardless of the area affected. What you need is a rectangular grid with evenly-spaced points in the X and Y directions. Select Options&gt;Generate Mesh to produce a grid with evenly-spaced points: </p>
<p><img src="http://www.dplot.com/blog/images/zavg040209_5.png" height="278" width="391" /> </p>
<p>There's no magic involved in setting the number of intervals; any value that produces new points at a higher frequency than your original data will give a more realistic answer than your original plot. The "Bivariate" interpolation scheme generally results in a smoother surface than "Planar", but unless you have a good insight into your data there is usually no justification for using anything more complex than "Planar". The resulting plot, with the options shown above: </p>
<p><img src="http://www.dplot.com/blog/images/zavg040209_6.png" height="637" width="665" /> </p>
<p>The $MEAN value shown here (which will now match the status bar value unless/until you zoom) is a much better guess at an "average" Z.</p>
<p>For your second question: "... or to integrate an area to directly compute the total lumen energy applied there?": Sure. Use Generate&gt;Find Volume Under Surface to... well... find the volume under the surface. This is numerically equivalent to integrating the surface. </p>
<p></p>
<p><img src="http://www.dplot.com/blog/images/zavg040209_7.png" height="366" width="300" /> </p>

<p>If you divide the volume given by that dialog (4272.45) by the total area (2500) you get an "average" Z value of 1.70898, slightly different than the $MEAN value of 1.733036. The difference is due to the $MEAN calculation giving equal weight to all data points, including those along the edges of the surface. Which value is more useful for your particular application? I have no idea :-). Different applications will have different answers.</p>
]]>
        
    </content>
</entry>

<entry>
    <title>Contour plots - shades AND lines</title>
    <link rel="alternate" type="text/html" href="http://www.dplot.com/blog/2009/04/contour-plots---shades-and-lines.html" />
    <id>tag:dplot.com,2009:/blog//1.2</id>

    <published>2009-04-27T22:29:05Z</published>
    <updated>2009-08-04T14:28:17Z</updated>

    <summary>From support e-mail: Q: Am using DPlot 2.0.7.4. I need to know if DPlot can show labels around shaded bands. I have attached an example file. A: Starting with version 2.2.4.7, yes you can, in 2D views. Here&apos;s a 2D...</summary>
    <author>
        <name>David Hyde</name>
        
    </author>
    
        <category term="Contour lines" scheme="http://www.sixapart.com/ns/types#category" />
    
    <category term="contourlabels" label="contour labels" scheme="http://www.sixapart.com/ns/types#tag" />
    <category term="contourlines" label="contour lines" scheme="http://www.sixapart.com/ns/types#tag" />
    <category term="surfaceplots" label="surface plots" scheme="http://www.sixapart.com/ns/types#tag" />
    
    <content type="html" xml:lang="en-US" xml:base="http://www.dplot.com/blog/">
        <![CDATA[From support e-mail: 
<p><strong>Q:</strong> Am using DPlot 2.0.7.4. I need to know if DPlot can show labels around shaded bands. I have attached an example file. 
</p><p><img src="http://www.dplot.com/blog/images/shadesandlinesquery.png" height="481" width="480" /> 
</p><p><strong>A:</strong> Starting with version 2.2.4.7, <strong>yes you can</strong>, in 2D views. Here's a 2D view of the mountain range example from the <a href="http://www.dplot.com/features.htm#THREED">Features</a> page: 
</p><p><img src="http://www.dplot.com/blog/images/shadesandlines1.png" height="553" width="643" /> 
</p><p>Starting with version 2.2.4.7 the Contour Options dialog has a few changes of interest here: 
</p><p><img src="http://www.dplot.com/blog/images/shadesandlinesdlg.png" height="525" width="592" /> 
</p><p>In particular note "Both lines and shades" under "Type" and that the "Contour lines" box has one additional entry and one entry that behaves a bit differently. You can specify a minor line width (in this example I've used 0", which results in a 1-pixel wide line) and the frequency entry, which previously was only used for the frequency of text labels, is now also used to specify which lines are "major". The results, using the options in the dialog above: 
</p><p><img src="http://www.dplot.com/blog/images/shadesandlines2.png" height="546" width="623" /> 
</p><p>The change related to minor contour line widths is of course also useful for Type="Contour lines" plots. 
</p><p>"Both shades and lines" is currently only available with 2D views (and will likely stay that way.)</p>]]>
        
    </content>
</entry>

</feed>
