Graph Software for Scientists and Engineers
Graph Software for Scientists and Engineers | ||
Probability ScaleA probability scale is primarily useful in statistical studies. It will show the
cumulative distribution function
of a normally distributed variable
as a straight line.
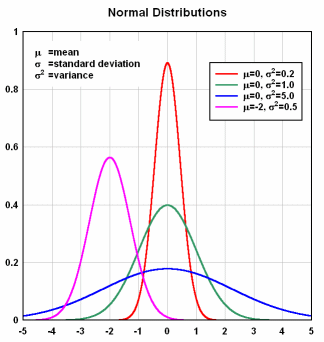 The cumulative distribution function of a standard normal distribution (mean=0, standard deviation=1) is simply the integral of the normal distribution curve. Cumulative distributions for the data graphed above are shown on a linear scale here: 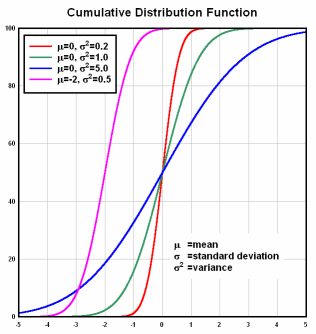 The amplitudes of these curves have been multiplied by 100. By default DPlot works with probabilities within the range 0-100, exclusive, while other applications may express probabilities in the range 0-1. If you are working with probabilities ranging from 0 (no chance) to 1 (certainty), you can multiply those amplitudes by 100 so that they may be plotted on a probability scale in DPlot. Select Edit>Operate on Y and type "Y*100" for f(Y). Right-click on the graph and select Linear X - Probability Y to get: 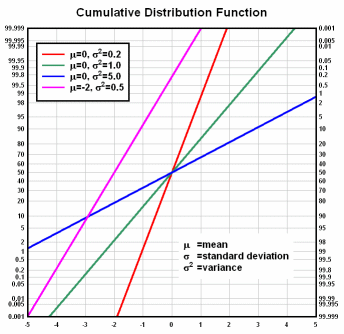 Alternative to multiplying your probability values by 100 (in the case of a 0-1 range), after setting the scaling you can right-click on the graph, select Probability Scale Options, then select 0 < p < 1 under Input Range.
|
RUNS ON
Windows 10, Windows 8, Windows 7, 2008, Vista, XP, NT, ME, 2003, 2000, Windows 98, 95 |