|

  
|
||
|
|
||
If you elected to install the DPlot Interface add-in when you installed DPlot, you should see a "DPlot" menu entry in Microsoft Excel 2003 and previous versions:
In Excel 2007 and later, if you select the Add-Ins tab then you should see a DPlot entry at the left of the screen under the Home tab:

In Excel 2010 and 2013, you should see something similar to:

If you do not see something similar to the above then either 1) you did not install the optional Add-In when you installed DPlot, 2) the Add-In actually was installed but a security setting in Excel has disabled it, 3) a user with an account different than your own (most likely an administrator) installed DPlot for you, or 4) you're using Excel 2013 or later and another Add-in is preventing the ribbon from being modified. Each of these issues is addressed below.
If you did not install the Add-In you can do so simply by re-installing DPlot to the same folder where it currently exists (the default is c:\Program Files\DPlot or c:\Program Files (x86)\DPlot on 64-bit systems), this time making sure to check the "MS Excel Add-In" box. You will need to exit DPlot before re-installing.
If you did install the Add-In but do not see a DPlot menu in Excel:
In Excel 2003 and previous verions
Select "Add-Ins" on the Tools menu:
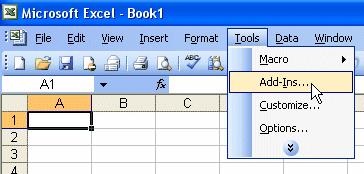
There should be a "DPlot Interface" box:

Check that box, then click OK. If there is not a "DPlot Interface" box, then most likely DPlot was installed by a different user than you, probably an administrator because you have a limited-privileges user account. In that case click the "Browse" button and navigate to the folder where DPlot was installed (default location=c:\Program Files\DPlot). Select the file dplotlib.xla then click OK.
In Excel 2007
Click the Office button in the upper left corner:

On the resulting screen click "Excel Options" at the bottom of the window.
Click "Add-Ins" in the left pane.
At the bottom of the next screen, ensure that the "Manage" selection is "Excel Add-Ins" then click "Go"
The next dialog is identical to that for Excel 2003 shown above. Check the "DPlot Interface" box (or follow the instructions above if that box is not present), then click OK.
In Excel 2010 and later
Click the File tab. Click Options. In the left pane select Add-ins.
At the bottom of the next screen, ensure that the "Manage" selection is "Excel Add-Ins" then click "Go"
The next dialog is identical to that for Excel 2003 and 2007 shown above. Check the "DPlot Interface" box (or follow the instructions above if that box is not present), then click OK.
If you properly installed the Add-In but now when starting Excel 2003 or previous versions you see an error message complaining about Run-time error '438', the most likely cause is some previous operation that has, for whatever reason, caused Excel's toolbar to temporarily lose its mind. You can correct this problem with the following steps:
| • | Start Excel. Select Tools>Customize. Click the Toolbars tab. |
| • | Near the end of the Toolbars list, find Worksheet Menu Bar. Select that entry so that it is highlighted. |
| • | Click the Reset button. When asked whether you really want to do this, click OK. |
| • | Click the Close button, then exit and restart Excel. |
| • | If you previously deactivated the DPlot Add-In to get rid of this error message, select Tools>Addins, check the DPlot Interface box, then click OK. |
Trust Center settings with Excel 2010 and 2013
If your Trust Center settings have "Require Application Add-ins to be signed by Trusted Publisher" checked (which may not be optional in corporate settings), then when you start Excel you will most likely see a Security Warning. Click on "Some active content has been disabled. Click for more details." Click the "Enable Content" button, then "Advanced Options". In the Security Alerts window you may see several Add-ins or other components that are not "trusted". Find "Signed by: HydeSoft Computing LLC" and select "Trust all documents from this publisher". Click OK. It may be necessary to exit and restart Excel for the Add-in to be "trusted".

In Excel 2013 and later
If you followed the instructions above with Excel 2007 or later and either the Add-Ins tab is not shown or the DPlot menu is not displayed when clicking the Add-Ins tab, it is most likely because of new functionality in Excel 2013 that gives every workbook a unique ribbon. This alone should not be a problem, but other Add-ins might foul up the works for additional changes to the default ribbon. In particular we've found that if the Analysis ToolPak and Analysis ToolPak - VBA are loaded before the DPlot Add-in, the DPlot Add-in will not show up on the ribbon. To get around this problem:
| 1. | Select File>Options>Add-ins. |
| 2. | Ensure that the "Manage" selection is "Excel Add-Ins" then click "Go" |
| 3. | Uncheck the boxes next to any add-in other than "DPlot Interface". (You're going to reload everything to finish this up, so there is no harm in unloading add-ins. They won't be deleted or uninstalled, just not loaded.) |
| 4. | Click OK, exit and restart Excel. |
| 5. | Most likely the DPlot Add-in will now show up on the ribbon. In any case, reload the add-ins you were previously using, if desired: |
| 6. | Select File>Options>Add-ins. Again click the Go button. Check the boxes for the add-ins you want to load. |
To use the Add-In, start Microsoft Excel and open the worksheet containing the data you'd like to plot in DPlot. If you are unfamiliar with the Add-In you will find the example Excel spreadsheet EXAMPLES.XLS useful. This sheet includes examples for all of the functions in the Add-In. EXAMPLES.XLS is installed to the DPlot folder below your "My Documents" folder and is also stored on the DPlot web site. (The links here to EXAMPLES.XLS may or may not open the file in Excel, depending on which service pack of the particular version of Windows you are using.)
The Add-In contains functions that allow you to pass data from Excel to DPlot, producing any type of plot that DPlot currently supports.
Key Add-In features:
| • | For all functions other than ZGrid (see below), you may use multiple selections if your data columns are not adjacent. This differs from using Copy/Paste, which results in copying ALL values within the extents of all selections. |
| • | Data is passed as floating point numbers and internally is independent of the formatting. With Copy/Paste, data is passed as text, exactly as it appears in your worksheet. If you only show 2 decimal places then the data is truncated to 2 decimal places in DPlot. |
| • | Blank cells are interpreted as you'd expect. |
| • | All functions other than OneD attempt to use the same formatting in DPlot that is used in Excel (dates, for example). |
Add-In Functions
XYXY
Select alternating X,Y columns and produce an XY plot. Column selections may have differing numbers of rows.
XYYY
Same as above, but X is taken from the first selected column and all subsequently-selected columns are Y values for separate curves. If only one column is selected, it is assumed to be Y values and X is generated, starting at 0 and incremented by 1. Y columns may have blank cells.
Creates 1 curve on an XY plot with X is taken from the first selected column, Y taken from the second selected column, and text labels in the third column. Label cells may be blank.
Creates a bar chart with non-numeric labels on the X axis and 1 or more groups of amplitudes.
Same as Bar chart command, with data sets in the same row rather than the same column.
OneCurvePerRow
Similar to XYXY, but data is arranged by rows rather than columns, with alternating X and Y values in adjacent columns. Each row is used to produce one curve.
XYZSurface
Select an X, a Y, and a Z column (one or more selections). Produce a 3D surface plot.
XYZScatter
Select one or more groups of X,Y,Z columns and produce a 3D scatter plot, one data set per X,Y,Z group.
ZGrid
Select a table with X in the first row, Y in the first column, and the remainder of the table filled with Z values for the corresponding X and Y. Produces a 3D surface plot.
OneD
Select one or more columns of amplitudes and produce a box-and-whisker plot.
Editing the Add-In
The Visual Basic for Applications (VBA) routines in DPLOTLIB.XLA are protected against editing, mainly to avoid confusion with other VBA functions you might create. If you are comfortable with VBA and would like to experiment with the add-in's features:
| 1) | We strongly suggest that you first make a backup copy of the .XLA file. In Office 2000, DPLOTLIB.XLA can be found in the \Microsoft\Addins folder below the Application Data folder. For Office 2007 and later, DPLOTLIB.XLA is found in %appdata%\Microsoft\Addins. (%appdata% is a Windows shortcut to a real folder, whose name changes with different Windows versions and language.) For earlier versions of Excel DPLOTLIB.XLA will be stored in the \Library folder below EXCEL.EXE. Save the backup copy of the Add-In to a different folder so that you won't become confused on Excel's Add-In's dialog. |
| 2) | Unload the Add-In: Select Tools>Add-Ins and uncheck "DPlot Interface". |
| 3) | Select Tools>Macro>Security. On the Security Level tab, ensure that "Low" is checked. Don't be concerned about changing your security level; this is only a temporary change that will enable you to edit and run VBA functions. |
| 4) | Open the Add-In file (DPLOTLIB.XLA, see above for the location of this file) using File>Open. |
| 5) | Select Tools>Macro>Visual Basic Editor: |

In the Project Explorer window, click on the + symbol next to DPlotLib (dplotlib.xla):
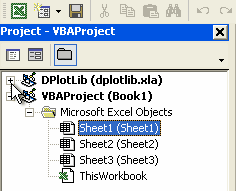
If you do not see the Project Explorer window, select Project Explorer on the View menu. After clicking on the + symbol next to DPlotLib (dplotlib.xla) you will be prompted for a password. Enter "dplot" in all lowercase letters (without the quotation marks).
| 6) | The functions under Microsoft Excel Objects (This Workbook) simply create the DPlot menu and delete the menu if/when the add-in is unloaded. The meat of the add-in is under Modules in DPlotData. For more information on DPLOTLIB functions see the DPLOTLIB documentation at http://www.dplot.com/lib/index.htm |
| 7) | After making any changes, save your work, exit the VBA editor, reset your security level if necessary, and re-load the add-in using Tools>Add-Ins. |
| 8) | PLEASE NOTE: Saving the Add-In will cause it to no longer be signed by HydeSoft Computing. This may not be important on your system, but may prevent others from using your amended Add-In, dependent on their Trust Center settings. |
If you find that the Add-In commands almost, but not quite, meet your needs and you are reasonably comfortable with VBA, you can call the standard Add-In commands from your own VBA routine and then make changes to a plot, typically by sending command strings to DPlot. A couple of examples follow.
| 1) | Data arranged in columns such that the normal Add-In commands can produce the desired plot from a selection: |
Sub monthlysalesmacro()
Dim doc As Long
Dim ret As Long
Dim Sel As Object
Dim row As Long
Dim rnge As String
Dim d As Double
Set Sel = Selection ' Preserve user's current selection
Range("D:D,I:I").Select ' dates in column D, cumulative monthly sales in column I
Call XYXY
doc = DPlotGetActiveDocument()
If doc > 0 Then
' generate a new curve with amplitudes equal to the peak value for each month
ret = DPlot_Command(doc, "[RunPlugin(""Monthly Peak"")][SymbolSize(-1,150)]")
' delete the original curve
ret = DPlot_Command(doc, "[SelectCurve(1)][EditErase()]")
ret = DPlot_Command(doc, "[DateFormat(""yyyy"")]")
ret = DPlot_Command(doc, "[Title1(""My Sales"")][Title2("""")][NumberFormat(1,4)]")
' set the tick mark intervals to 365 days on X, $1000 on Y
ret = DPlot_Command(doc, "[TickInterval(1,365,1000)]")
' set the axis extents: whole years on X, 0 to next highest $1000 increment on Y
ret = DPlot_Command(doc, "[ManualScale(" & Str$(DateSerial(2001, 1, 1)) & ",0," & _
DateSerial(year(Now) + 1, 1, 1) & ",=(CEIL($YMAX/1000)*1000))]")
' generate 12-month moving average using previous 12 months
ret = DPlot_Command(doc, "[RunPlugin(""Moving Average"",""1,12,0,1"")]")
Call DPlot_Finish(doc)
End If
Sel.Select ' restore previous selection
End Sub
A few notes on the above:
| a) | To call the Add-In functions DPlot_Command or DPlot_Request you need the index of the currently active document (XYYY and other Add-In commands activate the plots that they create). That's where DPlotGetActiveDocument comes in. For a rather lengthy list of all available DPlot_Command commands, see Sending data to DPlot from another application. |
| b) | When finished with calling any DPlot functions in your macro, if you have called DPlot_Command or DPlot_Request, you should disconnect from the currently active DDE conversation. Otherwise the plot will work as expected, but certain mouse operations (e.g. displaying coordinates while moving your mouse across the plot) will not work as expected, as DPlot will think there is still an active DDE conversation and responding to those actions is not appropriate. Disconnecting from a conversation can be accomplished simply with: Call DPlot_Finish(doc) |
| c) | In the VBA editor select Tools>References and check dplotlib. If you do not do this you will get a "Sub or Function not defined" error from Excel. |
| 2) | Data produced by another VBA module or data source or not conveniently arranged for the Add-In functions: |
Sub Test()
Dim d As DPLOT ' DPLOT structure defined in the Add-In
Dim doc As Long
Dim ret As Long
Dim x(0 To 3) As Double
Dim y(0 To 3) As Double
x(0) = 1
x(1) = 2
x(2) = 3
x(3) = 4
y(0) = 1
y(1) = 2
y(2) = 3
y(3) = 4
d.Version = DPLOT_DDE_VERSION
d.DataFormat = DATA_XYXY
d.MaxCurves = 1 ' Must be >= number of curves
d.MaxPoints = 4 ' Must be >= maximum number of points for all curves
d.NumCurves = 1 ' Actual number of curves
d.NP(0) = 4 ' Number of points in first curve
d.LineType(0) = 1
d.ScaleCode = SCALE_LINEARX_LINEARY
DPlot_Plot8 d, x, y, ""
doc = DPlotGetActiveDocument()
If doc > 0 Then
ret = DPlot_Command(doc, "[AppShow()]")
Call DPlot_Finish(doc)
End If
End Sub
The same notes from the previous example apply here.
Page url:
https://www.dplot.com/help/index.htm?helpid_addin.htm