|
XYZ Scatter |

  
|
|
XYZ Scatter |
|
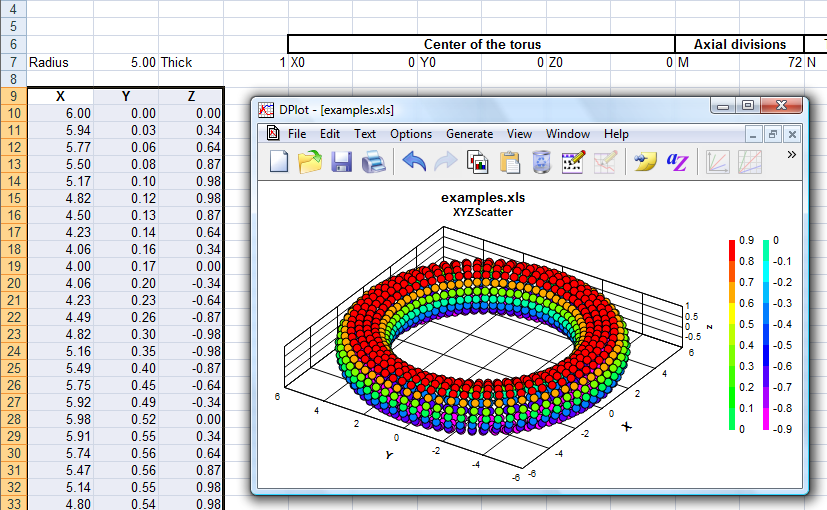
Select one or more groups of X,Y,Z columns and produce a 3D scatter plot, one data set per X,Y,Z group.
Initial plot settings:
If more than one data set (3 columns) is selected, then the column heading for the Z values, if present, will be used as a legend.
If more than one data set is selected, symbols are colored according to which data set they belong to. If one data set is selected, symbols are colored by Z value. These options may be changed by right-clicking on the plot and selecting "Scatter Plot Options".
All symbols will initially be drawn as circles. Symbol type and size may be changed by right-clicking on the plot and selecting "Symbol Styles".
Example:
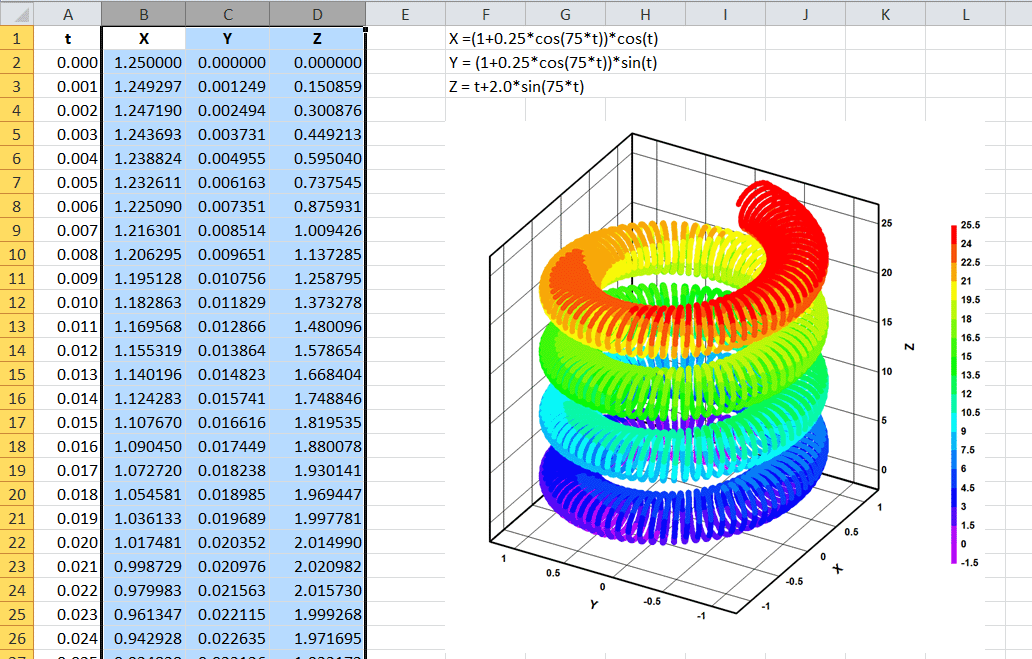
Second example, graphing 3D parametric equations:
Page url:
https://www.dplot.com/help/index.htm?xyzscattercommand.htm