Q: Am using DPlot 2.0.7.4. I need to know if DPlot can show labels around shaded bands. I have attached an example file.
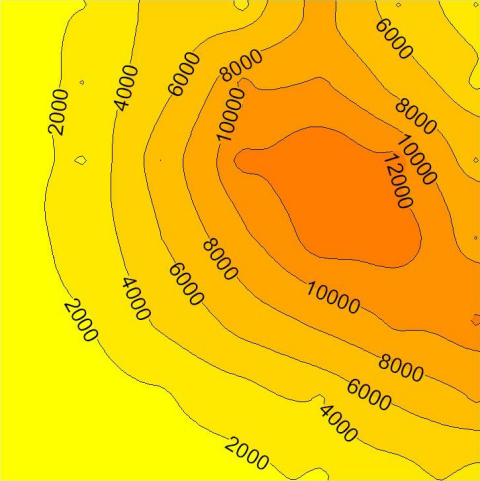
A: Starting with version 2.2.4.7, yes you can, in 2D views. Here's a 2D view of the mountain range example from the Features page:
Starting with version 2.2.4.7 the Contour Options dialog has a few changes of interest here:
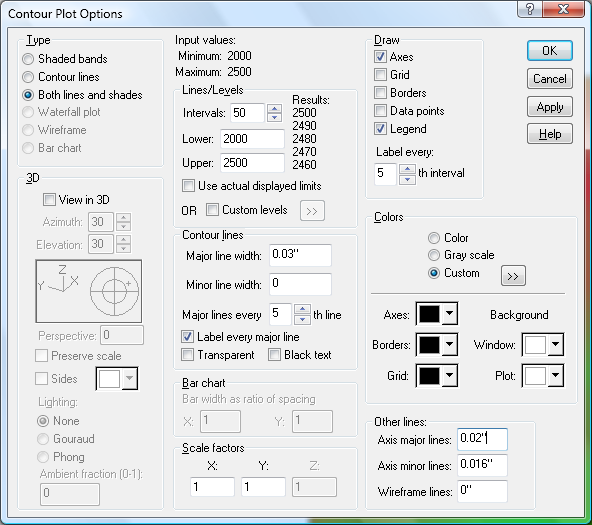
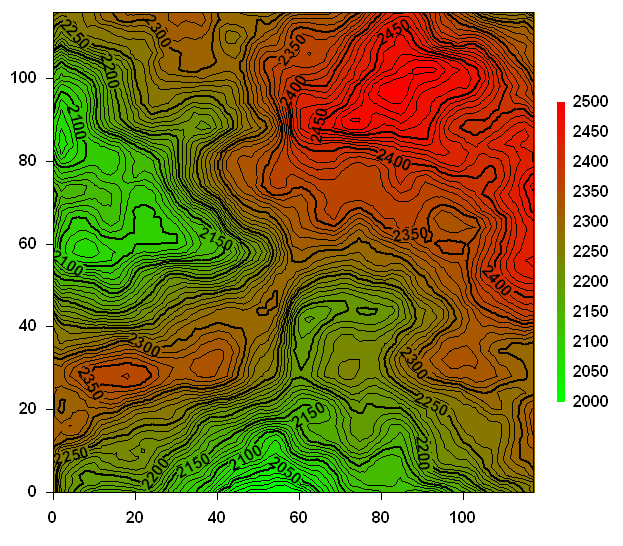
In particular note "Both lines and shades" under "Type" and that the "Contour lines" box has one additional entry and one entry that behaves a bit differently. You can specify a minor line width (in this example I've used 0", which results in a 1-pixel wide line) and the frequency entry, which previously was only used for the frequency of text labels, is now also used to specify which lines are "major". The results, using the options in the dialog above:
The change related to minor contour line widths is of course also useful for Type="Contour lines" plots.
"Both shades and lines" is currently only available with 2D views (and will likely stay that way.)