|

Graph Software for Scientists and Engineers
|
|
|
|
|
|
|
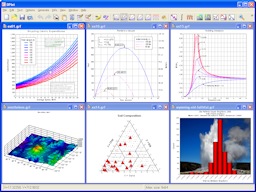
 A graph generated within DPlot by an equation. For step-by-step instructions to create this and other example plots see the Online Manual. Labeling specific data points. For options and capabilities see the Online Manual. Mt. St. Helens elevation, from SRTM data. Triangle Plot with USDA soil classifications. DPlot includes layouts for mafic and ultramafic rocks and Ab-An-Or minerals. You can easily create your own borders and labels for custom classifications.
|
Graph and manipulate 1, 2, 3, and 4-D dataCreate presentation-quality graphsCreate contour plots of 3 and 4-D dataUse data from a variety of sources
You can buy a single-user DPlot license for $195(US). If you buy DPlot for your
department, we offer multi-user discounts. Click the button below to purchase DPlot by credit card now, or check the
Buy DPlot page for more information on pricing and payment options.
Visit the DPlot features page to see dozens of stunning graphs that you can create. You may download our free 30-day
trial version and see how easily you can turn your data into eye-opening charts.
|
"The DPlot software is excellent. I couldn't do my job without it. (Well, actually I probably could, but I sure wouldn't enjoy it as
much!)"
Dan Meyer
Chief Engineer,
AerojetCredit: Pat Corkery/Lockheed Martin
RUNS ON
Windows 10,
Windows 8,
Windows 7, 2008,
Vista, XP, NT,
ME, 2003, 2000,
Windows 98, 95
|
|
Copyright © 2023-2024 ARA


