If you are not familiar with graphing inequalities in DPlot, please take a look at the How do I graph an inequality? page before proceeding. It includes specifics on a few DPlot operations that we'll assume you're familiar with in this topic.
A "system" of inequalities is a set of inequalities, usually two or three, that you deal with all at once. The solution to the system of inequalities is simply the intersection of the solutions for each of the individual parts. The technique for solving the system is identical to that for an individual inequality, with one additional step at the end.
Example: Graph the solution to:
3x - 2y < 15
x + 8y < 40
x > 2
Just as with solving single inequalities, it is usually best to solve as many of the inequalities as possible for "y" on one side. Doing so gives us:
y > 1.5x - 7.5
y < 5 - x/8
x > 2
For the first two inequalities we can use the Y=f(X) command on the Generate menu, as we did with single inequalities. Use Y=1.5*X-7.5 for the first (don't forget the multiplication symbol), and Y=5-X/8 for the second. For both inequalities extents of +10 will work fine. Again, the interval is not critical since we are dealing with straight lines.
But what about the third? We cannot use Y=f(X) because the inequality is independent of Y. There are a couple of ways to handle this, both relatively simple:
1. Select Edit Data on the Edit menu (or click the "Edit data" button on the toolbar), select "New Curve", and enter two endpoints for a line segment with X=2. The Y values don't matter as long as the extents will cover the Y range we are interested in. The other two inequalities with X = +10 give us extents of roughly -25 < Y < 10, so the two points (2,-25) and (2,10) will work nicely. Click OK after entering those two values.
2. Switch Y for X, use Y=f(X) with Y=2 and -25 < X < 10, then swap the X and Y coordinates of this line with the Swap X,Y command on the Edit menu.
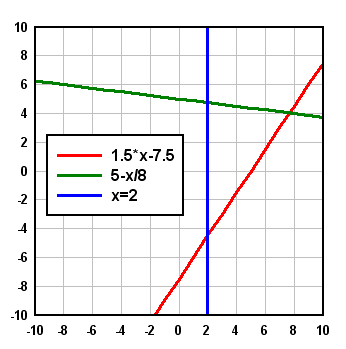
After setting the extents of the graph as before (using Extents/Intervals/Size on the Options menu) you should now have a graph that resembles the following:

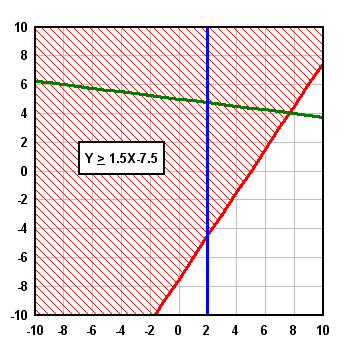
Now select the Fill Between Curves command on the Options menu. We want a fill area for each of the inequalities. For Fill No. 1 select 1.5*X - 7.5 in the "Curve1" list. Since the inequality is > in this case we want to fill the area above the line, so in the "Curve2" box select Top. Likewise for the second inequality (<) select Bottom, and for the third (X > 2), select Right. The solution for each individual inequality is shown below:


The combination of all 3 solutions is a bit busy and not especially useful:

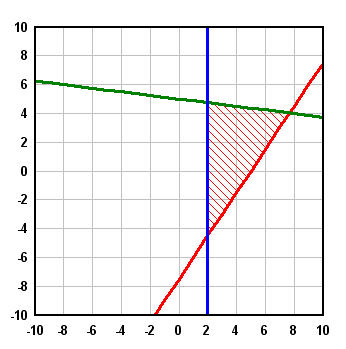
The solution we are looking for is the intersection of the three individual solutions. Return to the Fill Between Curves command and check the Draw only the intersections of all areas box. The solution:

Note that the fill color and style from the first fill area will always be used when this option is selected; all other color and style settings are ignored.
It is possible, of course, that there will be no solution to your set of inequalities. For example if you check the Draw only the intersections of all areas box for this graph:

no fill area will be drawn, since the two areas do not overlap (and since the boundaries are parallel, they will not overlap at any X). This is the correct solution, and DPlot will not issue any error messages or warnings in this case.
As with single inequalities, we have used linear functions in all examples for simplicity. But there is nothing restricting you from using more complex functions (polynomials, trigonometric functions, etc.) for this technique. One important difference with non-linear inequalities is that when using the Y=f(X) command, the interval between X values now is important in order to get sufficient detail. In general you'll want to use an interval of the X extents divided by 1000, or smaller. For high-order polynomials a smaller interval may be needed.
Page url:
https://www.dplot.com/help/index.htm?how_system_inequalities.htm