|
EX16.GRF |

  
|
|
EX16.GRF |
|

The example plot shows contours of some phenomenon measured at various gauge locations in an L-shaped room. In this topic we'll recreate a less complex, but similar plot. The gauge locations for this exercise are shown here:

...and the peak measurements from those gauges are displayed in the following table. The first two columns are the X and Y coordinates (horizontal distance in a plan view) within the room; the third column is our "Z" values that we want contours of. Select the entire table with your mouse (click and drag over the table), right-click and select Copy. In DPlot, select Paste Special on the Edit menu, then check 3D - X, Y, Z values.
0.1 |
0.1 |
28.03 |
0.1 |
4 |
28.34 |
0.1 |
8 |
27.82 |
0.1 |
12 |
28.48 |
0.1 |
15.9 |
39.32 |
0.1 |
20 |
49.54 |
0.1 |
24 |
58.19 |
0.1 |
28 |
81.38 |
0.1 |
32 |
81.38 |
0.1 |
36 |
58.19 |
0.1 |
40 |
49.54 |
0.1 |
44 |
39.67 |
0.1 |
48 |
28.48 |
0.1 |
51.9 |
41.42 |
4 |
0.1 |
26.44 |
4 |
4 |
26.18 |
4 |
8 |
23.73 |
4 |
12 |
17.88 |
4 |
15.9 |
22.79 |
4 |
20 |
38.43 |
4 |
24 |
63.3 |
4 |
28 |
73.4 |
4 |
32 |
73.4 |
4 |
36 |
63.3 |
4 |
40 |
38.43 |
4 |
44 |
22.08 |
4 |
48 |
19.37 |
4 |
51.9 |
22.73 |
8 |
0.1 |
27.5 |
8 |
4 |
22.16 |
8 |
8 |
16.84 |
8 |
12 |
20.88 |
8 |
15.9 |
25.03 |
8 |
20 |
48.5 |
8 |
24 |
73.4 |
8 |
28 |
110.16 |
8 |
32 |
110.16 |
8 |
36 |
73.4 |
8 |
40 |
48.5 |
8 |
44 |
25.35 |
8 |
48 |
21.94 |
8 |
51.9 |
30.85 |
12 |
0.1 |
20.37 |
12 |
4 |
21.57 |
12 |
8 |
19.46 |
12 |
12 |
19.98 |
12 |
15.9 |
25.03 |
12 |
20 |
48.5 |
12 |
24 |
73.4 |
12 |
28 |
110.16 |
12 |
32 |
110.16 |
12 |
36 |
73.4 |
12 |
40 |
48.5 |
12 |
44 |
25.35 |
12 |
48 |
21.94 |
12 |
51.9 |
30.85 |
16 |
0.1 |
23.59 |
16 |
4 |
20.66 |
16 |
8 |
19.87 |
16 |
12 |
19.17 |
16 |
15.9 |
21.83 |
16 |
20 |
38.43 |
16 |
24 |
63.3 |
16 |
28 |
73.4 |
16 |
32 |
73.4 |
16 |
36 |
63.3 |
16 |
40 |
38.43 |
16 |
44 |
22.08 |
16 |
48 |
20.05 |
16 |
51.9 |
22.73 |
19.9 |
0.1 |
19.15 |
19.9 |
4 |
19.81 |
19.9 |
8 |
20.76 |
19.9 |
12 |
18.03 |
19.9 |
15.9 |
39.32 |
19.9 |
20 |
49.54 |
19.9 |
24 |
58.19 |
19.9 |
28 |
81.38 |
19.9 |
32 |
81.38 |
19.9 |
36 |
58.19 |
19.9 |
40 |
49.54 |
19.9 |
44 |
39.67 |
19.9 |
48 |
28.48 |
19.9 |
51.9 |
41.42 |
24 |
0.1 |
21.69 |
24 |
4 |
21.53 |
24 |
8 |
21.04 |
24 |
12 |
20.39 |
24 |
15.9 |
17.4 |
28 |
0.1 |
23.17 |
28 |
4 |
20.61 |
28 |
8 |
17.92 |
28 |
12 |
20.06 |
28 |
15.9 |
22.22 |
32 |
0.1 |
28.97 |
32 |
4 |
23.43 |
32 |
8 |
21.96 |
32 |
12 |
19.9 |
32 |
15.9 |
22.33 |
36 |
0.1 |
25.44 |
36 |
4 |
24.93 |
36 |
8 |
22.55 |
36 |
12 |
21.01 |
36 |
15.9 |
23.54 |
39.9 |
0.1 |
34.64 |
39.9 |
4 |
27.66 |
39.9 |
8 |
25.67 |
39.9 |
12 |
24.79 |
39.9 |
15.9 |
29.21 |
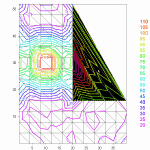
The resulting plot will look something like this:

What happened to the L-shape? To help understand what happened here select the Contour Options command on the Options menu and check Borders under Draw. This will show the edges of the triangles that DPlot produced from our 3D points:

As shown above, the plot includes triangles outside our room that we don't want. Why are those triangles there? DPlot must make an assumption about what our surface looks like, since our table of X,Y,Z points contains no connectivity information or any clues about which points define the outside edges of the surface. The assumption made by DPlot is that our surface is convex - it will never produce a triangular mesh with concave exterior angles or with interior holes. For a great many problems this will be the "correct" surface, but is clearly incorrect in this case. We can easily remedy this, though, using either of two methods:
Delete Triangles
Select the Delete Triangles command on the Edit menu and click on the triangles outside the L-shape. As you click on a triangle it will be redrawn in reverse video. If you select a triangle accidentally, click it again to toggle it back on.
There is one gotcha concerning the Delete Triangles command: if you edit one or more X or Y values of your plot in any way, DPlot will generate a new triangulation, which of course will produce a new convex mesh. So if your data requires any editing you should of course perform that editing before using Delete Triangles.
Once all of the triangles you want to delete are selected, click the Delete button. Your plot should now resemble this:

If you'd prefer shaded bands of color as in the example plot rather than contour lines, select the Contour Options command on the Options menu and select Shaded bands under Type.

Define boundary
For a more persistent change to the plot shape than Delete Triangles provides, use the Define Boundary command on the Options menu. This command allows you to specify the endpoints of the line segments that form the exterior boundary of your surface. (You can also use this command to specify holes in your surface; for more information see the Help topic for Define Boundary). Unlike Delete Triangles, triangles deleted by this command will not be regenerated every time a new triangular mesh is produced. Another advantage over Delete Triangles, though it may not be apparent in this example, is that the border may often be defined with many fewer points than there are triangles to delete. For example, in the plot EX16.GRF that this example is based on there were originally 55 excess triangles, while the border can be completely defined with 6 points.
The border may start at any location and proceed in either a clockwise or counterclockwise direction around the surface. Border points do not necessarily have to be on the surface. X and Y components of each point may be separated by commas, spaces, or tabs, one point per line. As you enter each line you will see the border being updated on the plot, drawn as a reverse video line.
Along with typing the values you can use the mouse to select points by left-clicking the desired location on the plot. Points selected with the mouse will be added at the current line in the text box if the caret is in the leftmost position; otherwise these points will be added/inserted on the line following the caret. For best results with the mouse you might prefer to check the Snap to nearest data point box. If that box is checked, then the X and Y values of the data point closest to the mouse position will be used, rather than the converted mouse coordinates. Snap to nearest data point has no effect on values you type in, nor will checking this box modify values that are already present, regardless of how they were entered.
After entering all border points and selecting OK, DPlot will delete any triangles whose average X and Y value is outside the border. The average value is used as a check simply because it is mathematically trivial to compute and it is guaranteed to be inside the triangle. Note that this command will not clip triangles which cross the border but whose average value is inside the border.