This command allows you to specify the X and Y boundaries of a surface plot generated from random 3D points. This command can also be used to create holes in a surface.
Why is this command needed?
By default, DPlot will always generate a convex mesh of triangles from random 3D points. A simple list of points does not contain sufficient information to determine what the boundary of the surface should be, so DPlot makes this simplifying assumption that in many cases is appropriate. Of course there are many cases where this assumption is not appropriate. For concave edges you can delete unwanted triangles with the Delete Triangles command on the Edit menu, but that process may be time-consuming and, pertinent for program developers, requires interaction from the end user. And if the X or Y coordinates of a surface are edited in any way then a new convex mesh will be generated, destroying any work done with the Delete Triangles command. The Define Boundary command handles all of those shortcomings:
The border may often be defined by many fewer points than there are excess triangles.
The border is persistent. Changes to the data that result in a new triangulation will not generate triangles outside the border.
This procedure, unlike Delete Triangles, can be performed from another program with a call to DPlot_3DBorder in dplotlib.dll.
Operation
The border may start at any location and proceed in either a clockwise or counterclockwise direction around the surface. Border points do not necessarily have to be on the surface. X and Y components of each point may be separated by commas, spaces, or tabs, one point per line. As you enter each line you will see the border being updated on the plot (2D only), drawn as a reverse video line.
You do not need to close the boundary; DPlot will automatically connect the last point to the first.
Along with typing the values, if you are viewing the plot in 2D then you can use the mouse to select points by left-clicking the desired location on the plot. Points selected with the mouse will be added at the current line in the text box if the caret is in the leftmost position; otherwise these points will be added/inserted on the line following the caret. For best results with the mouse you might prefer to check the Snap to nearest data point box. If that box is checked, then the X and Y values of the data point closest to the mouse position will be used, rather than the converted mouse coordinates. Snap to nearest data point has no effect on values you type in, nor will checking this box modify values that are already present, regardless of how they were entered.
After entering all border points and selecting OK, DPlot will delete any triangles whose average X and Y value is outside the border. The average value is used as a check simply because it is mathematically trivial to compute and it is guaranteed to be inside the triangle. More specifically, for every triangle in the plot DPlot extends a horizontal line to the right, past the rightmost extreme of the data. It counts intersections of this line segment with all border line segments. If the number of intersections is odd, the triangle is inside the border; if even, the triangle is outside.
Note: Data points found to be outside the border are not deleted; only triangles are deleted. So if you later use the Define Boundary command to remove the border, the original surface will be restored.
Holes
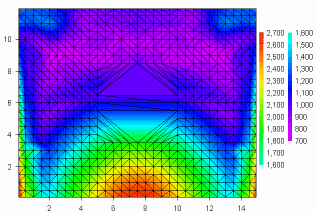
Along with defining the exterior edges of your surface you can use this command to specify holes in your surface. The trick is to ensure that the path along the border from the exterior of the surface is exactly the same, but in the reverse direction, as the path from the hole back out to the exterior edge. As an example, this plot:

depicts peak pressure measurements across the face of a wall with an opening in the center of the wall. No gages were located within the opening, so the plot is at best misleading. If you use the Contour Options command to turn on the triangle borders then the opening location becomes more apparent:

You can use Define Boundary to remove all of the triangles inside the opening. In the example shown, the points picked as the border are numbered 1-12, starting at the lower left corner and proceeding counterclockwise around the surface. Note that point 4 (at the top of the surface) is the same as point 11 and point 5 (at the top of the hole) is the same as point 10. In short, the path taken from the exterior edge to a hole can be anywhere on the surface as long as the exit path lies along those same points. For best results (to avoid roundoff errors) the entrance/exit path should be vertical or horizontal.

Finally, here is the result of using Define Boundary to remove triangles from the opening:

Page url:
https://www.dplot.com/help/index.htm?helpid_edit3dborder.htm