|
EX09.GRF |

  
|
|
EX09.GRF |
|

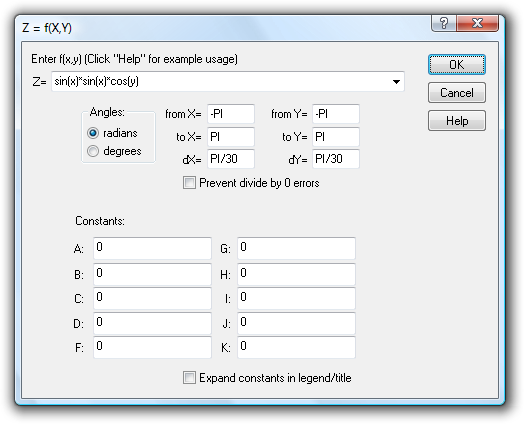
This topic illustrates generating a 3D surface plot from an equation. First, open a new document window (File>New>3D surface). Now select Generate>Z=f(X,Y), which allows us to generate a 3D surface with Z (height) values a function of X and Y. You are of course welcome to use any equation you like; this example uses Z=sin(x)*sin(x)*cos(y) with X and Y extents = + pi radians. Note that you can enter the value “PI” for 3.14159… in the extents boxes in addition to numbers and simple equations.
We've used an interval on both the X and Y axes of PI/30, which should be more than sufficient (in this case) to capture all of the details of the equation without trying our patience: That interval gives us 61 columns by 61 rows of data values for a total of 3721 points. On reasonably fast computers DPlot will take no more than a few seconds to plot 3D surfaces with 100,000 or so points.
This initially produces a two-dimensional plot with contour lines:

To switch to a 3D view, switch to shaded bands rather than contour lines, change the number of contour intervals or the upper and lower limits of those contours, and/or change the color scheme used for the contours, select Options>Contour Options. The settings used for the example plot are shown here:

For a description of all of these options see the Contour Options topic.
To show the X and Y axis values as fractional values of pi rather than the default number format, right-click on any number on the respective axis and select “Pi Fractions”.
To change the extents of the axes and/or the tick mark interval used on each axis, select Options>Extents/Intervals/Size.