|

  
|
||
| Show/Hide Hidden Items |
|
|
||
| Show/Hide Hidden Items |
Displays a dialog box that allows you to specify the appearance of contour plots for 3D and 4D data. To edit the Z values of plots on a rectangular grid, or any of the X,Y,Z components on a plot of random points, use the Edit Data command on the Edit menu or click the Edit Data button on the toolbar:
Edit Data button: ![]()
Type
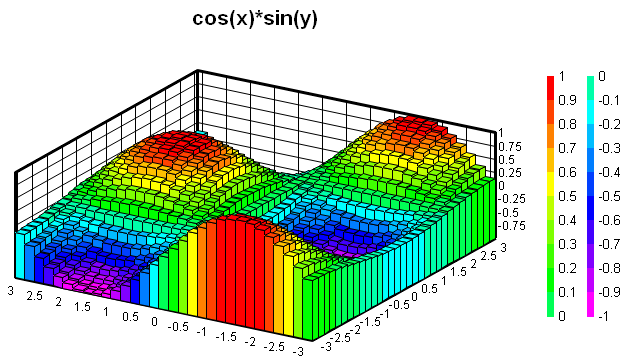
![]() Shaded bands- represents ranges of Z with different color bands.
Shaded bands- represents ranges of Z with different color bands.
|
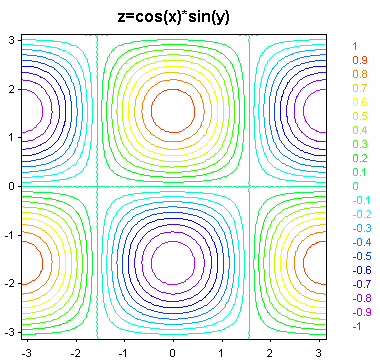
![]() Contour lines - draws contour lines at user-specified intervals (2D views only)
Contour lines - draws contour lines at user-specified intervals (2D views only)
|
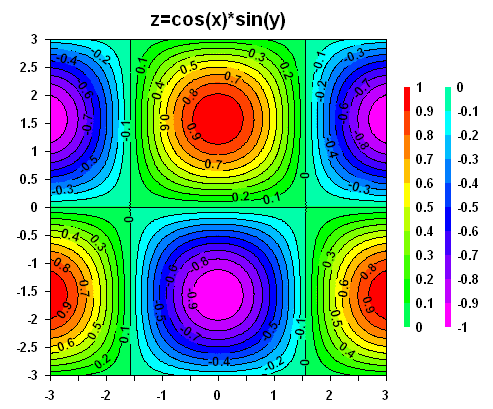
![]() Both shades and lines (2D views only)
Both shades and lines (2D views only)
|
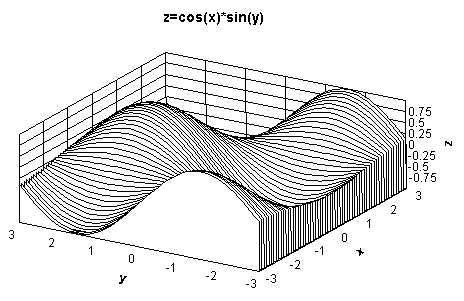
![]() Waterfall plot - draws lines along the surface at constant values of X.
Waterfall plot - draws lines along the surface at constant values of X.
This option is only valid for gridded data (as opposed to randomly-spaced 3D points), and is disabled if "View in 3D" is unchecked. NOTE: To reorganize your randomly-spaced 3D points into a rectangular grid, use the Generate Mesh command. |
![]() Wireframe - draws grid lines and/or element edges ("Borders") along the surface. No hidden line/surface removal.
Wireframe - draws grid lines and/or element edges ("Borders") along the surface. No hidden line/surface removal.
This option is disabled if "View in 3D" is unchecked. Lighting, contour interval, and "Draw sides" settings are ignored. If both the "Grid" and "Borders" options under "Draw" are unchecked, border lines (lines delineating each grid rectangle or triangle) will be drawn. Line width is controlled by the "Wireframe lines" setting under "Other Lines". |
|
The Waterfall and Bar Chart options are disabled for random 3D points; these options are only valid for Z values on a rectangular grid. To produce an interpolated rectangular grid from random 3D points use the Generate Mesh command on the Options menu.
View in 3D
If checked, the plot is drawn with a 3D projection using the view angles specified by “Azimuth” and “Elevation”. If unchecked, the plot is drawn as a plan view of the XY plane.
|
Azimuth - view angle around the z axis. 0 degrees is looking in the positive X direction; 90 degrees is looking in the positive Y direction.
Elevation - view angle from the horizontal. 0 degrees gives an elevation view; 90 degrees is looking straight down at the surface. For a top-down view with X axis at the bottom of the plot and the Y axis labels along the left side of the plot, use elevation and azimuth both equal to 90 degrees.
Also see Shortcuts below for keyboard shortcuts to change the azimuth and/or elevation angles while viewing the plot.
Angles control - the graphic below the Elevation text box allows you to select viewing angles with your mouse. Click within the circle to change the viewing angles. The center of the circle represents an elevation angle of 90 degrees (looking straight down at the surface), the inner circle is 45 degrees, and the outer circle is 0 degrees (viewing along the XY plane). The 3D unit axes will rotate as you move the mouse across this control. View angles will not be changed until you click within the circle.
You cannot select a negative elevation angle (looking up at the surface from underneath) using this control. To use a negative elevation angle enter the value in the Elevation text box or click on the corresponding spin button. (Note, though, that negative elevation angles are not recommended for most plot types.)
Perspective - if set to a positive value, determines (roughly) the distance from the viewpoint to the center of an imaginary box surrounding the surface for a perspective projection. This value is a multiplier for one-half the diagonal of that box. If less than or equal to 0, a normal orthographic projection will be drawn, with no consideration for perspective. DPlot will force a positive perspective value to a minimum of 1.0 (viewpoint on the surface of the smallest sphere that surrounds the plot). That minimum value typically distorts the plot to a larger degree than you will find desirable. Larger values will typically result in better-looking plots. A good starting point for the perspective value is 2.0.
Note: Perspective projection typically does not work well with high elevation angles and bar charts.
perspective=2
|
Preserve Scale - If checked, then the next time this plot is drawn the scale factor used to force the plot into the specified extents (or the available document area if extents are not specified with Extents/Intervals/Size) will be used on all subsequent renderings when spinning the plot around using the keyboard shortcuts described below. This option is primarily useful for smooth animations; if this option is not used then the plot size will tend to increase/decrease and possibly shift left, right, up, or down as you spin it around using the keyboard shortcuts. Note that this may mean that portions of the plot will be clipped when using this option. For best results first select viewing angles that will make the plot take up the largest portion of screen space - typically this will be at azimuths of 45, 135, 225, or 315 degrees.
Draw sides - If checked, planes will be drawn from the edges of the plot to the XY plane, obscuring the underside of the surface. You should not use an elevation angle less than 0 if Draw sides is checked. The edges of each plane will be drawn in the border color. Planes will be filled with the color specified by the control adjacent to the Draw sides checkbox.
|
Lighting - choose from None, Gouraud, or Phong shading. Gouraud shading generally results in the surface having a faceted appearance. Phong shaded surfaces look much smoother, but require additional processor time and significantly more memory, particularly for very large data sets. Both models, as implemented in DPlot, assume a single light source in the direction of the viewpoint, infinitely far away. The effect of this assumption is that the light source vector is constant across the surface, and the light intensity is the same at all locations. No specular reflections are performed.
|
|
Ambient light fraction - values are limited to the range 0-1, inclusive. With 0 ambient light, planes that are near edge-on to the light source vector (the viewpoint) will be very dark. At the other extreme, a setting of 1 is equivalent to full brightness; the light source has no effect on appearance.
Lines/Levels
Intervals - Number of contour intervals to display. Limited to 255 bands or lines.
Lower/Upper Limit - Lowest and highest contour values. Keep in mind that the interval between legend values will be different for shaded bands than for contour lines. For shaded bands the interval is (upper limit-lower limit)/(number of intervals). For contour lines the interval is (upper limit-lower limit)/(number of intervals-1).
Use actual displayed limits - Check this box if you would like for DPlot to automatically adjust the lower and upper contour limits when you zoom in/out and/or force the plot extents by using the Extents/Intervals /Size command on the Options menu. If checked, the Intervals entry will be used as a guideline; the actual number used may be slightly more or less. If you zoom in to such an extent that only one data point is visible, or if all visible data points have the same magnitude, the lower and upper limits will be forced to that value +/- 5%, or +/- 0.5 in the case of Z=0.
Leave this box unchecked to specify the lower and upper limits, which will then remain in effect on zoomed plots.
Custom Levels - If checked, then the Intervals, Lower limit and Upper limit settings are ignored and you may enter up to 255 unevenly-spaced contour values by clicking the adjacent >> button. This feature might be handy when a surface plot includes important details in specific Z ranges and those ranges are several orders of magnitude smaller than the Z extents.
Results - Shows the top five contour intervals that will be displayed, so you don't need to perform the division mentioned above in your head.
Use > and/or < in legend - If checked, for shaded bands if the maximum amplitude is more than 1 contour interval greater than the high contour value, DPlot adds a > prefix to the high value in the legend. It will use the same logic for the low value and a < prefix. If unchecked, these prefixes will not be added. This setting only effects shaded bands, not contour lines.
Contour lines
Line width - Controls the width of the pen used to draw contour lines. NOTE: Colors and/or gray shades may not be printed correctly with very small line widths if your printer must simulate colors with dithered patterns. For example, an HP LaserJet uses patterns of black and white dots to simulate various colors and gray shades. Similarly, many color printers simulate a wide range of colors by using patterns of cyan, magenta, and yellow dots. If the pattern used by the printer to produce these simulations is wider than the specified line width, the output will not be as you expected. In particular, a 0.0” line width (1 printer dot) may result in a single white (invisible) line. For best results when printing colors or gray shades, the minimum line widths for all curves and grid lines should be set to no less than 12 dots, or 0.02 inches on a 600 dpi printer or 0.04 inches on a 300 dpi printer.
If you specify a line width less than 0 for the major or minor lines, the corresponding lines will not be drawn.
Label every... - If checked, DPlot will draw the contour values on a 2D contour line plot, regardless of whether Display Legend is checked. Control the frequency of the labels with the adjacent text box.
Transparent - If checked, the background of labels is not drawn. Otherwise a white background is used, usually obscuring the underlying contour line. (This option is ignored for "Both lines and shades", for which labels will always be opaque, preserving the background color.)
Black text - If checked, labels are drawn in black. Otherwise labels are drawn using the same color used for the corresponding contour line. (This option is ignored for "Both lines and shades", for which labels will always be drawn in black.)
Horizontal - If checked, all labels will be horizontal. If unchecked, labels will be oriented with the respective contour line at the point the label is drawn.
B/W based on luminance - This setting is only applicable when "Both lines and shades" is used. If the luminance (red*0.3 + green*0.59 + blue*0.11) of the region above the contour line is some threshold value or greater, the label is drawn in black. Otherwise the label is drawn in white.
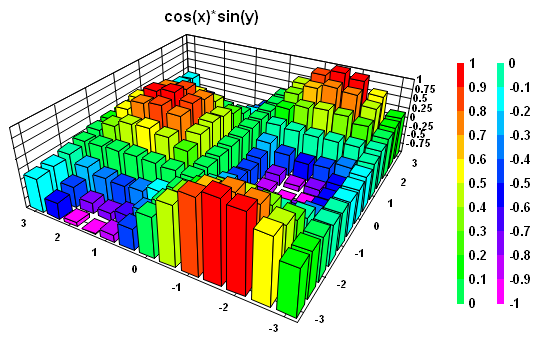
Bar chart widths
These entries are disabled if Bar chart is not selected under Type. These values are the widths of bars as a fraction of the spacing between points in the X and Y directions. Valid entries range from 0.0-1.0.
|
|
|
|
Scale Factors
Specifies how the X, Y, and Z extents are stretched or compressed relative to each other. These values are not related to the physical size of the plot. For example 1:2:4 results in the same effect as 3:6:12. This has no effect on the actual data values, only on appearance. You can have DPlot automatically initialize these scale factors to give square extents using the General command on the Options menu. Use a negative scale factor to invert the normal drawing direction.
Draw
Axes - If checked, the coordinate planes are drawn as a series of grid lines on 3D plots, and a box with X and Y scales is drawn around 2D plots. X and Y axis labels will not be drawn unless “Draw axes” is checked.
Grid - Draws grid lines across the plot at the same interval as the X and Y axis labels. The frequency of these tick marks can be changed with the Extents/Intervals /Size command on the Options menu.
Borders - Draws lines through the contour control points. For random 3D points this will draw the borders of the triangles. For points on a rectangular grid this results in lines around each grid cell. For bar charts, if this option is checked then bar edges are drawn in the border color. If unchecked bar edges are not drawn.
Data points - Draws filled black squares in the specified size at each data point. For all output devices, the square is rounded to the nearest odd number of pixels/printer dots, so that it will be centered on the point. Squares will be at least 3 pixels/dots wide and tall regardless of the size setting. Ignored for waterfall plots and bar charts.
Legend - Displays a legend using either color bars for “shaded bands” or colored text for “contour lines”.
Label every __ interval - Controls the frequency of contour labels in the legend. If set to 1, every contour line will have a corresponding label in the legend. If set to 2, every other contour line will have a corresponding label, etc.
Colors
Choose between a smooth gradation of colors ranging from magenta to red, black to very light gray, or a custom blend of up to 64 colors that you specify.
NOTE: On 2D contour plots, if you use a custom color palette with more than one color and set the color for the low and high levels to the same color, then DPlot considers the contour values to cycle; in other words it considers the low end of the scale to be equivalent to the high end of the scale. In this case, triangles that have all three vertices at either the high or low end of the scale will use the same solid color across the entire face of the triangle. In the case of contour lines, no lines will be drawn on this triangle.
|
Related macro commands |
|
Shortcuts (3D views): |
CTRL+ |
Decrease azimuth by 1 degree |
CTRL+ |
Increase azimuth by 1 degree |
CTRL+ |
Decrease elevation by 1 degree |
CTRL+ |
Increase elevation by 1 degree |
CTRL+SHIFT+ |
Decrease azimuth by 5 degrees |
CTRL+SHIFT+ |
Increase azimuth by 5 degrees |
CTRL+SHIFT+ |
Decrease elevation by 5 degrees |
CTRL+SHIFT+ |
Increase elevation by 5 degrees |
Please note: These shortcuts work best with simple plots: no more than a few thousand data points, antialiasing and lighting turned off. Surface plots tend to be sluggish as DPlot draws each individual pixel. If looking for the best viewing angle, consider using the right-click Wireframe option, rotating the plot to the desired orientation, then switching back to a surface plot with that same right-click menu.
Page url:
https://www.dplot.com/help/index.htm?helpid_contourplot.htm