|
SymbolOpacity macro command |

  
|
|
SymbolOpacity macro command |
|
Macro commands may be used either in macros or by sending the commands to DPlot via dynamic data exchange (DDE). Some commands are valid only in macros (noted by Macros Only). Commands sent to DPlot via DDE must be enclosed by square brackets [ ]. Macro commands should not include the brackets.
Command parameters shown in the descriptions below are placeholders for the actual values. Command parameters are either numeric values, equations that evaluate to numbers, or character strings. Character string parameters are always bound by double quotation marks. Equations must be preceded by an equals sign (=).
The pipe symbol (|) in the command syntax indicates that a parameter is optional, and should not be included in your macro unless otherwise noted.
All indices into arrays are 1-based, e.g. Curve1=1 refers to the first curve in a plot.
A 0x prefix for numbers in the descriptions below indicates hexadecimal notation; e.g. 0x0010 = 16.
![]() JR/Viewer indicates that the command is supported by DPlot Jr or DPlot Viewer.
JR/Viewer indicates that the command is supported by DPlot Jr or DPlot Viewer.
![]() JR/Viewer indicates that the command is NOT supported by DPlot Jr or DPlot Viewer.
JR/Viewer indicates that the command is NOT supported by DPlot Jr or DPlot Viewer.
[SymbolOpacity(curve,opacity)] |
|
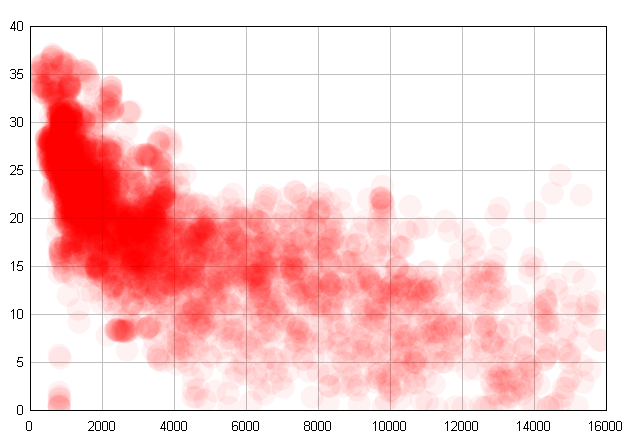
Controls the opacity of symbols in an XY plot. Default opacity value is 100 (%). Valid values range from 0 (completely transparent) to 100 (opaque). If curve is set to -1 or omitted, the opacity value is applied to all curves.
Symbol opacity < 100 is ignored for output to standard and enhanced metafiles. (This is because partially transparent symbols are drawn pixel-by-pixel, which would result in very large metafiles and in any case defeat the scalability of metafiles.) This setting is also ignored for displays with color depth of 256 or fewer colors.
The SymbolOutline setting is ignored for opacity values < 100: outlines of solid symbols will not be drawn; symbols will be drawn with a single color.
This feature might be useful for showing the density of data points. For example, here is an example using standard opacity=100% symbols:
and here is the same image with the symbol size increased from 0.10" to 0.30", opacity set to 5%:
____________________________
See also
Symbol/Line Styles menu command
Page url:
https://www.dplot.com/help/index.htm?symbolopacity_macro_command.htm