|
How do I draw a smooth curve through sparse data? |

  
|
|
How do I draw a smooth curve through sparse data? |
|
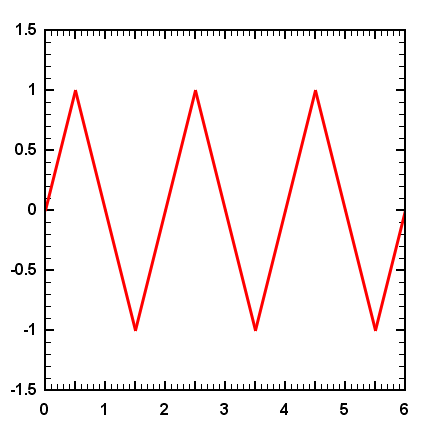
For XY plots DPlot will always draw straight line segments between data points. The sawtooth curve below, for example, contains only 13 points, with an increment in X of 0.5:
If you would prefer a smooth curve through those points... you need more points. If you have additional data available then the best solution is of course to use that data. But you can also have DPlot generate additional data using one of several interpolation schemes with the Equal Intervals command on the Edit menu:
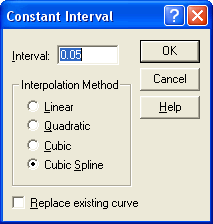
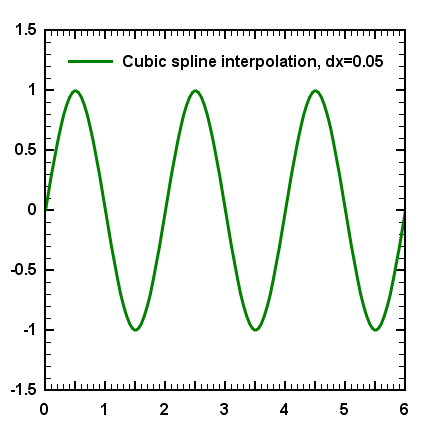
For a smooth curve you'll most likely want 100 or more points. In this example we'll use an interval of 0.05, which will produce 121 points between X=0 and X=6. The Linear interpolation method is useful for producing evenly-spaced points from unevenly-spaced data, but, as you'd expect, the result will appear identical to the original data. The Quadratic and Cubic interpolators will produce a smoother curve, but with discontinuities in the slope near either end of the curve. Generally the Cubic Spline interpolator is the best choice when all you're trying to do is draw a smooth curve. The result of Cubic Spline with an interval of 0.05 on the orginal data is shown below.
Page url:
https://www.dplot.com/help/index.htm?how_eqints.htm