|
DPlot file miscellaneous identifiers |

  
|
|
DPlot file miscellaneous identifiers |
|
Miscellaneous identifiers in a DPlot file consist of a descriptive keyword followed by associated data, if any. A description of each of the currently supported miscellaneous identifiers follows:
1000Separator
Obsolete. Use 1000Separators. Followed by a non-zero entry if a 1000 separator (character set with Control Panel) should be used. If zero, no 1000 separator will be used.
1000Separators
Followed by 4 numbers indicating whether the Control Panel-specified character should be used to separate the 1000’s place in numbers on each of 4 axes. (X,Y,Z on 3D plots or X,Y,alternate X, alternate Y on XY plots).
AxesAtZero
Equivalent to checking "Axes at 0" under Options>Grid Lines or Box.
AxisLineWidth
Followed by the line width used to draw coordinate axes, in 100'th inch units.
BarChartOptions
Followed by an integer value that is a combination of:
| 0x00000001 | Filled bars |
| 0x00000002 | Stacked bars |
| 0x00000004 | Draw bar amplitude labels |
| 0x00000008 | Draw percentage labels |
| 0x00000010 | Labels drawn outside (on top of) the bars |
| 0x00000020 | For unevenly spaced X values, bars extend from X to the following X. Last point is ignored other than to provide the ending X of the last bar. Ignored if more than one data set is present. |
| 0x00000040 | Percentage labels (if drawn) are a percentage of this bar's amplitude relative to all data sets. If not set, percentage is for the associated data set only. |
| 0x00000080 | A different color is used for each bar. The color assigned to curve #1 (with the Colors command) is used for the first bar, and in general the color assigned to curve N is used for the Nth bar. This option is ignored if the bar chart has more than one data set. |
| 0x00000100 | Base of bars is at minimum Y extent. If not set, base of bars will be at Y=0. |
| 0x00000200 | Don't draw black border around filled bars. |
| 0x00000400 | Draw border around extremes only. In other words, if bar width and group width (see below) are both set to 1.0, there will be no vertical lines between bars. Ignored if more than one data set is present. If set, 0x0200 bit (don't draw black border) is ignored. |
| 0x00000800 | Shade bars as if they are cylindrical. Ignored unless the fill style is set to solid. |
BarPctLabels (Obsolete, but currently supported. BarChartOptions is preferred)
Equivalent to checking Percentage labels on the Bar Chart Options dialog and/or BarChartOptions with the 8 bit set.
BarWidth
Followed by the width (0.0-1.0) of bars in bar charts and histograms. A value of 1.0 results in bars with no intervening space.
BorderPoints
Defines the exterior edge of a surface plot for random 3D data. Followed by the number of points then the X and Y values of each point, one point per line.
Cal
Followed by the gage calibration value. Used in the title for data processing mode.
Caption
The filename of a graph will be placed near the lower right corner. Without this option the caption will not be drawn.
ColorBasis
Followed by an integer value that determines what parameter the colors in a 3D scatter plot are based on. 0=Z value, 1=data set, 2=view depth.
Colors
Obsolete. This keyword is supported by all versions of DPlot but will not be written to DPlot files. Followed by up to 16 color specifications used for XY plots, in 4-byte hexadecimal notation: 00rrggbb, where each of the color components vary from 00 to FF.
ColorsEx
Followed by the color specification for each curve of an XY plot in 4-byte hexadecimal notation: 00rrggbb, where each of the color components vary from 00 to FF. Colors will be written to the file with up to 10 colors per line. For example if a plot contains 16 colors then the first 10 colors will be written to the line immediately following ColorsEx and colors 11-16 will be written to the next line.
Contour3d
Will show the surface plot in a 3D view. Followed by the Z scale factor (see Contour3DScale), azimuth and elevation angles (in degrees).
Contour3Daxes
If followed by a non-zero integer, the 3 coordinate planes will be drawn with a 1-dot black pen on 3D contour plots.
Contour3DScale
Followed by X, Y, and Z scale factors to stretch the contour plot by. These settings have no effect on the actual data values, only on appearance.
ContourColor
Defines the color scheme for contour plots. Followed by 0 for a smooth gradation of colors ranging from magenta to red, 1 for a gray scale palette ranging from black to a very light gray, or 2 for a custom blend of 6 colors defined by contourusercolors.
ContourDrawSides
If followed by a non-zero value, black-edged white planes will be drawn from the edges of a 3D surface plot to the XY plane, obscuring the underside of the surface. This setting should not be used with an elevation angle less than 0.
ContourGrid
If followed by a non-zero integer, grid lines on contour plots are drawn with a 1-pixel black pen. If followed by 0, grid lines are not drawn.
ContourLabels
Controls labelling of contour lines on a 2D surface plot. Followed by an integer that is a combination of:
| 1 | Label lines (if not set, other bits are ignored) |
| 2 | Labels are transparent. If not set, the background of labels will be opaque, possibly obscuring the underlying plot. |
| 3 | Labels use black text. If not set, label text is the same color as the corresponding contour line. |
ContourLegend
If followed by a non-zero integer, a legend describing contour intervals is drawn on the right side of contour plots. If followed by 0, the legend is not drawn.
ContourLegendFreq
Followed by the frequency of the labels in the legend, minus 1, of a surface plot or 3D scatter plot. 0=include every label, 1=every 2nd label, etc.
ContourLevels
Followed by the number of contour levels, the low contour value and the high contour value. Keep in mind that the interval between legend values will be different for shaded bands than for contour lines. For shaded bands the interval is (upper limit-lower limit)/(number of intervals). For contour lines the interval is (upper limit-lower limit)/(number of intervals-1).
ContourLevelsEx
Serves a similar purpose to ContourLevels, but is used when custom contour values rather than equally-spaced contours are used. Followed by the number of contour levels on the next line, then each of the contour values, one per line.
ContourMethod
Followed by:
| 0 | Contour plots are drawn using shaded bands representing ranges in elevation. |
| 1 | Contour plots are drawn with contour lines representing specific elevations. If "Contour3D" is set, this setting is forced to 0. |
| 2 | Waterfall plot. "Contour3D" is forced on. This setting is not valid for randomly-spaced points (only for gridded data). |
ContourSymbols
Followed by the symbol type to draw at each data point in a surface plot. (Currently the actual type is ignored; if non-zero, square symbols will be drawn.)
ContourUserColors
Followed by from 1 to 16 color definitions used to construct a color palette when ContourColor=2. If the number of contour intervals is greater than the number of colors, DPlot interpolates between color values. Colors are expected to be 4 byte hexidecimal values, with the red component in the least significant byte. For example,
ContourUserColors
0000ffff,000000ff
creates a palette starting at yellow (low contour) with decreasing green values out to full red for the highest contour line/shade.
ContourXYScale (obsolete. Use Contour3Dscale)
Followed by X and Y scale factors to stretch the contour plot by. These settings have no effect on the actual data values, only on appearance.
Date
Followed by 1 to display today's date in the upper-right corner of the plot. If the following value is greater than 1, DPlot converts this number from an Excel serial number to a calendar date. In either case, if/when the plot is saved as a DPlot file the date will be updated to today's date.
Date Format
Followed by the format description for the date used when the Number Format for either X or Y is "Calendar Date". Default value is the short date format set in Control Panel (normally M/d/yy).
DataProcess
Turns on data processing mode. Followed by
Format, DataType, UseDPlotLabels
Shift1,Start1,Stop1
Shift2,Start2,Stop2
Shift3,Start3,Stop3
Shift4,Start4,Stop4
where
| Format | general format of the plot. 0=square, 1=wide, 2=default |
| DataType | 0= unknown or don't care 1=pressure 2=stress 3=acceleration 4=deflection 5=strain 6=temperature |
UseDPlotLabels
If non-zero, axis labels are generated by DPlot automatically
| Shiftn | Baseline shift amount. |
| Startn | Start time of the n'th baseline shift |
| Stopn | Stop time of the n'th baseline shift |
DecimalDigits
Followed by three entries, 1 each for the X, Y, and Z axes, for the number of digits that should follow the decimal point in numbers along those respective axes when scientific notation, powers of 10, or the default number format is used. If less than 0, then DPlot does not use a fixed number of digits and trailing zeroes are removed.
DP_Units
Followed by Punits, Aunits, Vunits, Dunits, Tunits, descriptors for the units of the values in the file and/or values automatically generated by DPlot.
where
| Punits | Pressure units code, currently inaccessible within DPlot. 0 = psi 1 = megapascals 2 = kilopascals |
| Aunits | Acceleration units. 0 = g's 1 = feet/sec^2 2 = inches/sec^2 3 = meters/sec^2 |
| Vunits | Velocity units 0 = feet/sec 1 = inches/sec 2 = millimeters/sec 3 = centimeters/sec 4 = meters/sec |
| Dunits | Deflection/displacement units 0 = inches 1 = feet 2 = millimeters 3 = centimeters 4 = meters |
| Tunits | Temperature units 0 = degrees Fahrenheit 1 = degrees Celsius 2 = degrees Kelvin |
DenseGrid
Turns on dense gridline option (Options>Grid Lines or Box>Dense Grid Lines)
ErrorBar
Describes error bar parameters for a single curve. Followed by:
CurveNum,Display,Type,Value1,Value2
where
| CurveNum = | index of the curve. |
| Display = | how error bar is displayed (0=none, 1=above, 2=below, 3=both above and below). |
| Type = | how magnitude of error bar is determined. (0=absolute value, 1=percentage, 2=different absolute values for above and below). |
| Value1 = | Type-dependent parameter (absolute value, percentage, or plus value). |
| Value2 = | Type-dependent parameter (minus value for Type=2). |
ErrorBarPenWidth
Followed by pen width used to draw error bars, in 1/1000ths of an inch. Default=20.
ErrorBarWidth
Followed by the width of the horizontal part of error bar, in 1/1000ths of an inch. Default=250.
FilledBars
Causes bar charts to be drawn with solid interiors (default is hollow).
FillLabel
Legend entry for a fill area (see Fill Between Curves on the Options menu and FillRegion below). Followed by two integers in the first line and the label in the next line. Label is limited to 80 characters. The first integer should be 1 or 2; 2 is only valid if the fill is for "Fill to Y reference line" and is the label corresponding to the area below the refernce line. The second number is the fil index, 1 through the number of fill areas.
FillRegion
Paints the area between two curves with a pattern. Followed by:
Curve1, Curve2, Style, Color, Hatch |,yref, Color2|
where
Curve1 = index of first curve.
Curve2 = index of second curve.
0 = fill the area formed by closing Curve1
-1 = fill to the lower X axis
-2 = fill to the line Y=yref
Style = 0 for solid fill, 2 for a pre-defined pattern, or 3 for a user-defined pattern.
Color = Blue*65536 + Green*256 + Red, where each of Blue, Green, and Red range from 0 to 255.
Hatch = index of pre-defined patterns (ignored for Style not equal to 2)
0 = Horizontal lines
1 = Vertical lines
2 = 45 degree downward
3 = 45 degree upward
4 = Horizontal-Vertical cross-hatch
5 = 45 degree crosshatch
yref = Amplitude of the reference line used in the case of Curve2=-2.
Color2 = Color used to fill the area below the yref reference line when Curve2=-2.
If Style = 3, the next line must contain a string of 8 1-byte hexadecimal values (no separator) describing an 8x8 pixel bitmap.
Example:
FillRegion
0001 0002 0003 00000255 0000
AA55AA55AA55
Fills the area between curves 1 and 2 with a red user-defined pattern consisting of every other dot turned on.
FontColor
Followed by FontIndex, Color
where
FontIndex is the index of the font.
1 = numbers on the axes
2 = first title line
3 = second title line
4 = X axis label
5 = Y axis label
6 = legend
7 = note
Color is the color of the font in the form red*65536+green*256+blue.
Fontn
Followed by 45 comma-separated values describing FontIndex n (FontIndex described above): Height, Width, Escapement, Orientation, Weight, Italic, Underline, StrikeOut, CharSet, OutPrecision, ClipPrecision, Quality, PitchAndFamily, FaceName.
Width, Escapement, Orientation, CharSet, OutPrecision, ClipPrecision, Quality, and PitchAndFamily are ignored and reset to default values within DPlot.
Height is the font height in points.
Weight should range from 0 (don't care) to 900 (heavy).
Italic, Underline, and StrikeOut are 1 if that attribute is used; 0 otherwise.
FaceName is a string of 32 integers that are the ASCII equivalents of the font name. Unused characters are set to 0. For example, 'Arial' is
65,114,105,97,108,0,0,0,0,0,0,0,0,0,0,0,0,0,0,0,0,0,0,0,0,0,0,0,0,0,0,0
FontFace (obsolete, but supported)
Followed by:
FontIndex
FontFace
where
FontIndex is the index of the font.
1 = numbers on the axes
2 = first title line
3 = second title line
4 = X axis label
5 = Y axis label
6 = legend
7 = note
FontFace is the name of the font to use; e.g., Times New Roman
Grain Flags
Additional formatting options for grain size distribution plots. Followed by an integer value that may be a combination of the following:
| 0x00000001 | Specify sieve size labels. If this bit is not set, bits 1 through 27 are ignored and all of the sieve sizes mentioned below will be drawn (if they will fit on the plot without overlapping and the plot extents include the given size) |
Bits 1-27 specify which sieve size labels to draw, dependent on bit 0x40000000 (British sizes, see below).
bit |
U.S. sizes |
British sizes |
0x00000002 |
6 inch |
125 mm |
0x00000004 |
4 inch |
75 mm |
0x00000008 |
3 inch |
63 mm |
0x00000010 |
2 inch |
50 mm |
0x00000020 |
1-1/2 inch |
37.5 mm |
0x00000040 |
1 inch |
28 mm |
0x00000080 |
3/4 inch |
20 mm |
0x00000100 |
1/2 inch |
14 mm |
0x00000200 |
3/8 inch |
10 mm |
0x00000400 |
#3 |
8 mm |
0x00000800 |
#4 |
6.3 mm |
0x00001000 |
#6 |
5 mm |
0x00002000 |
#8 |
3.35 mm |
0x00004000 |
#10 |
2.36 mm |
0x00008000 |
#12 |
2 mm |
0x00010000 |
#16 |
1.7 mm |
0x00020000 |
#20 |
1.18 mm |
0x00040000 |
#30 |
0.850 mm |
0x00080000 |
#40 |
0.600 mm |
0x00100000 |
#50 |
0.425 mm |
0x00200000 |
#60 |
0.300 mm |
0x00400000 |
#70 |
0.250 mm |
0x00800000 |
#100 |
0.212 mm |
0x01000000 |
#140 |
0.150 mm |
0x02000000 |
#200 |
0.125 mm |
0x04000000 |
#270 |
0.075 mm |
0x08000000 |
#400 |
0.063 mm |
| 0x10000000 | Draw bold vertical lines at material-type boundaries |
| 0x20000000 | Use Udden-Wentworth scale rather than AASHTO scale |
| 0x40000000 | Use British standard sieve sizes rather than U.S. sizes. |
| 0x80000000 | X axis increases from left-to-right. |
Grain FlagsEx
Specifies user-defined sieve sizes. Followed by an integer value that may be a combination of the following bits, which in turn is followed by the size, in millimeters, and text associated with each non-zero bit. This setting is ineffective unless bit 1 of the setting made with Grain Flags is set.
| 0x00000001 | Use the first user-specified sieve size. |
| 0x00000002 | Use the second user-specified sieve size. |
| 0x00000004 | Use the third user-specified sieve size. |
| 0x00000008 | Use the fourth user-specified sieve size. |
Example:
Grain FlagsEx
3
1.0
#18
0.710
#25
Specifies the use of two user-defined sieve sizes: 1 mm labeled "#18" and 0.71 mm labeled "#25".
GridColor
Followed by the color to use for grid lines, in the form red*65536+green*256+blue
GridColor2
Followed by the color to use for minor grid lines, in the form red*65536+green*256+blue
GridLinesOnTop
Followed by a single number describing the placement of grid lines on an XY plot:
0 below fill regions, curves, and reference lines
1 above fill regions
2 above fill regions and curves
3 above fill regions, curves, and reference lines
GridLineType
Followed by the line style codes to use for the major and minor grid lines (2 values). Both values should be between 1 and 7, inclusive.
GridLineWidth
Followed by the width of the line used to draw grid lines, in 1000'th inch units.
GridLineWidthThin
Followed by the width of the line used to draw minor grid lines, in 1000'th inch units.
Grid Type
Followed by the grid type to use. 0 = Axes only, 1 = Grid, 2 = Box. See Grid Lines or Box.
Hex Format
Followed by two numbers that describe the output when Hexadecimal number formatting is used: NumBytes, PrefixType
NumBytes should be 1, 2, or 4.
PrefixType = 0 for '0x', 1 for '$', or 2 for no prefix.
HideLegend
If present, the legend will not be drawn of XY plots. The legend can be made visible with the Legend/Labels menu command.
Invert Axis
For XY plots only, followed by 1 to reverse the normal direction of the X axis, 2 for the Y axis, or 3 for both the X and Y axes.
LabelBars (Obsolete, but currently supported. BarChartOptions is preferred)
Bars in bar charts will be labeled with the bar amplitude.
LabelDir
Followed by three numbers, one for each of the X, Y, and Z axes describing the orientation of numbers along those axes: 0=horizontal, 1=45 degrees, 2=vertical.
LegendLineLength
Followed by the length of the line segment to use in the legend, in inches. The default line segment length is 1/2 inch.
LineWidths
Followed by a list of line widths for each curve in the file, in hundredths of inches.
Lname
Followed by the title for the legend, which will be placed at the top of the legend. If no legend is present, "lname" may still be used to display miscellaneous text on the plot.
LogTicks
Followed by an integer that specifies the frequency of labels on logarithmic scales:
| 0 | Label integer powers of 10 only |
| 1 | Label 5's as well (e.g. 0.1,0.5,1,5,10,50,...) |
| 2 | Label all tick marks (as space allows) |
Manual Scale
Followed by the corner coordinates (in data space) of the plot window:
xlow, ylow,xhigh,yhigh
or, for 3D data:
xlow,ylow,zlow,xhigh,yhigh,zhigh
Manual Size
Followed by the physical width and height of the plot, in inches.
Manual Ticks
Followed by the physical width and height of the plot and the number of tick mark intervals in the X and Y directions. Obsolete. Use "Manual Size", "NumTicks", and/or "TickInterval" instead.
width, height, nXtick, nYtick
Margins
Followed by the left, top, right, and bottom margins of a hard copy, in inches.
MaxLegendRows
Followed by the maximum number of strings to place in a single column of the legend.
MinorGridLines
For XY plots and linear scales only, followed by the number of minor grid intervals between each tick mark on the X and Y axes.
Multiple Axes
Followed by an option code and related data:
code
A, B if code = 1
AxisNumber(i),i=1,nplot if code = 2
where
code = 1 for a second Y axis dependent on the primary Y axis; = 2 for a second, independent Y axis.
A,B = coefficient for a 1st order polynomial that translates primary Y axis values to second Y axis values.
AxisNumber(i) = array of numbers associating curves with axes. AxisNumber(1) must be 1.
See: Multiple Y Axes
NoArrowHeads
Arrowheads will not be drawn on the axes of XY plots.
NoLegendFrame
Turns off the default feature of drawing a rectangle around the legend.
NoteV2
Obsolete. This keyword is supported by all versions of DPlot but will not be written to DPlot files.
Text notation. Followed by:
X, Y, Flags, TabStop
Note\n
Note (cont.)\n
.
.
Note(cont.)
where
X,Y are the coordinates of the upper left corner of the note, expressed as a percentage of the plot size (0.0 to 1.0) or in data coordinates, dependent on the Flags setting.
Flags is a combination of the following:
| 0x0002 | Draw a rectangle around the note. |
| 0x0004 | Hide objects intersecting the note. If not set, note background is transparent. |
| 0x0008 | Note is “activated” by a button. |
| 0x0010 | X and Y are expressed in data space rather than the default ratios of plot size. If set, the note will remain in a fixed position relative to the plot’s data values when you zoom or otherwise change plot extents. |
TabStops is the number of character cells used for tab positioning.
Each line of the note other than the last line should end in the sequence “\n”. DPlot replaces “\n” with a <CR><LF> sequence when reading the note. There must be at least one additional line after the last occurrence of “\n”.
NoteV3
Text notation. Followed by:
X, Y, Flags, Alignment, TabStop
Note\n
Note (cont.)\n
.
.
Note(cont.)
where
X,Y are the coordinates of the alignment point of the note, expressed as a percentage of the plot size (0.0 to 1.0) or in data coordinates, dependent on the Flags setting.
Flags is a combination of the following:
| 0x0002 | Draw a rectangle around the note. |
| 0x0004 | Hide objects intersecting the note. If not set, note background is transparent. |
| 0x0008 | Note is “activated” by a button. |
| 0x0010 | X and Y are expressed in data space rather than the default ratios of plot size. If set, the note will remain in a fixed position relative to the plot’s data values when you zoom or otherwise change plot extents. |
Alignment is a combination of the following:
| 0x0001 | Note is placed such that the center of the note is at X. |
| 0x0002 | Note is placed such that the right extent of the note text is at X. |
| 0x0004 | Note is placed such that the vertical middle of the note is at Y. |
| 0x0008 | Note is placed such that the bottom extent of the note text is at Y. |
TabStops is the number of character cells used for tab positioning.
Each line of the note other than the last line should end in the sequence “\n”. DPlot replaces “\n” with a <CR><LF> sequence when reading the note. There must be at least one additional line after the last occurrence of “\n”.
NoteButton
Followed by the text that appears on a button used to activate a note. By default, the button text is "Note". Obsolete. This value is only applicable to the first note defined in the file. Use NoteButtonEx.
NoteButtonEx
Followed by the 1-based index of the applicable note, with the button text on the subsequent line.
NumberFormats
Followed by the number format codes for the X and Y axis.
NumberFormatZ
Followed by the number format code for the Z axis.
NumLegendSymbols
Followed by the number of symbols to use for each legend entry for curves that use symbols at each data points. Must be 1, 2, or 3.
NumTicks
Followed by the number of tick mark intervals on the X and Y axes (and Z in the case of 3D data). Alternatively, see "TickInterval".
PointSizes
Followed by:
NumFonts
Point(i),i=1,NumFonts
PolarOptions
Followed by Flags
where
Flags is a combination of the following bits:
| 0x0001 | 0 degrees at the top of the plot. If not set, 0 degrees is at the right side of the plot. |
| 0x0002 | Clockwise angles. If not set, angles increase in the counterclockwise direction. |
| 0x0004 | Force circular plots. If not set, plot may be elliptical, depending on the plot width and height. |
| 0x0008 | Radial axis labels are vertical. |
PtLabel
Prints a character string with an arrow directed toward a data point, XY plots only. Followed by:
CurveNum, PointNum, X, Y, Flags
Label
where
CurveNum, PointNum are the 1-based curve index and point within the curve associated with the label.
X, Y are the coordinates for the label, in plot space.
Flags consists of a series of style bits describing the appearance of the label:
| 0x0001 | Label consists of the amplitude of the data point. |
| 0x0002 | Label will be opaque. |
| 0x0004 | A rectangular frame will be drawn around the label. |
| 0x0008 | Rotate label 90 degrees. |
| 0x0010 | X and Y specify relative offsets from the labeled point, in inches. |
| 0x0020 | Label is only drawn when the mouse cursor is over the labeled point. |
Label is the character string, ignored if Flags & 0x0001 = 0x0001.
PtLabel3D
Prints a character string with an arrow directed toward a data point on a 3D surface plot. Followed by:
Dataset, Xpt, Ypt, Xlabel, Ylabel, Flags
Label
where
Dataset is currently unused. Set to 1.
Xpt, Ypt are the X and Y coordinates of the data point to label.
X, Y are the coordinates for the label, in plot space.
Flags consists of a series of style bits describing the appearance of the label:
| 0x0001 | Label consists of the amplitude (Z value) of the data point. |
| 0x0002 | Label will be opaque. |
| 0x0004 | A rectangular frame will be drawn around the label. |
| 0x0008 | Rotate label 90 degrees. |
| 0x0010 | X and Y specify relative offsets from the labeled point, in inches. |
| 0x0020 | Label is only drawn when the mouse cursor is over the labeled point. |
Label is the character string, ignored if Flags & 0x0001 = 0x0001.
Reflines
Describes up to 20 horizontal or vertical reference lines for XY plots. Followed by
NumRefLines
for i=1 to NumRefLines
Options,Style,Color,Width,Value
Legend (if Options > 1)
next i
| Options | 1 for a horizontal line, 0 for a vertical line, plus 2 if a legend entry is included. |
| Style | line style code |
| Color | ((blue*256)+green)*256+red |
| Width | line width in thousandths of inches |
| Value | X or Y value of the line |
SquareLogs
Forces physical distance between log cycles on the X and Y axis to be the same.
StackedBars (Obsolete, but currently supported. BarChartOptions is preferred)
Bars in bar charts for different data sets are stacked vertically rather than drawn side-by-side.
All entries prefaced by "Stat_" are applicable only to 1D statistics plots.
Stat_Box
Followed by several options defining how the box in a box-and-whisker plot is drawn:
Draw, Color, Width, BorderWidth, BorderColor
where
| Draw = | 0 to not draw the box, 1 to draw the box |
| Color = | Color used to draw the box, red + green*256 + blue*65536 |
| Width = | Width of the box, in 1000'th inch units |
BorderWidth =
Width of the line used as a border for the box, in 1000'th inch units. Set to 0 for no border.
BorderColor =
Color used for the border line around the box, red + green*256 + blue*65536
Stat_BWOptions
Followed by options for box-and-whisker plots:
MedianOrMean, DrawWhiskers, StdDevorErr, BoxLimits, WhiskerLimits, OutlierLimits, ExtremeLimits
where
MedianOrMean =
0 for a median-based plot, 1 for a mean-based plot
DrawWhiskers =
0 if whiskers should not be drawn, 1 to draw whiskers
StdDevorErr =
0 if mean-based limits are multipliers for the group standard deviation, 1 if limits are multipliers for the group standard error (group standard deviation divided by the square root of the number of samples).
BoxLimits =
Extents of the box. For median-based plots, this value should be a percentage (0-100) of the range in amplitudes for the group. For mean-based plots, a multiplier for the group standard deviation or standard error (dependent on the StdDevorErr value).
WhiskerLimits =
Extents of the whiskers. For median-based plots, this value should be a percentage (0-100) of the range in amplitudes for the group. This value is not used for median-based plots unless the stat_whisker Option value (see below) is 0. For mean-based plots, a multiplier for the group standard deviation or standard error (dependent on the StdDevorErr value).
OutlierLimits =
Limits defining outliers (distance from mean or median). For median-based plots, a multiplier for the interquartile range (box limits). For mean-based plots, a multiplier for the group standard deviation or standard error (dependent on the StdDevorErr value).
ExtremeLimits =
Limits defining extremes (distance from mean or median). For median-based plots, a multiplier for the interquartile range (box limits). For mean-based plots, a multiplier for the group standard deviation or standard error (dependent on the StdDevorErr value).
Stat_DotOptions
Followed by options for dot graphs:
Grouping, Symbol, Size, Color, CLimits, CStyle, CWidth, CSymbol, CSize, CColor
where
Grouping =
0 to plot individual data points scaled to their actual amplitude. Identical points are stacked. = 1 to group data points into bins, as in a histogram.
| Symbol = | Symbol style used for individual data points. |
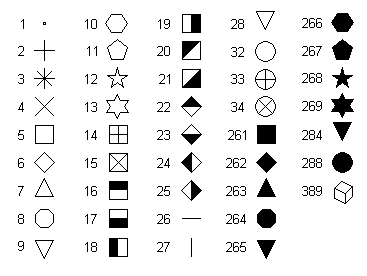
Note: Symbol type 389 is only available in 3D scatter plots.
| Size = | Height of symbol, in 1000'th inch units |
| Color = | Color used for individual data points, red + green*256 + blue*65536 |
| Climits = | Limits of confidence limit line, expressed as a multiplier for the group standard error. |
| CStyle = | Line style used for confidence limit line. |
1=solid line
2=long dash
3=dotted
4=dash dot
5=medium dash
6=dash dot dot
| CWidth = | Pen width used for confidence limit line, in 1000'th inch units. |
| CSymbol = | Symbol style to draw at the ends of the confidence limits line (see symbol codes above) |
| CSize = | Height of CSymbol, in 1000'th inch units. |
| CColor = | Color used for confidence limits, red + green*256 + blue*65536 |
Stat_DrawLegend
If followed by a non-zero integer, a legend will be drawn with 1D statistics plots. If followed by 0, the legend is not drawn.
Stat_GrandMean
Followed by:
Flags, Width
where
| Flags = | Combination of bits. If 1 is set, draws the grand mean/median through the mean or median of all values in all groups. If 2 is also set (Flags=3), the legend entry for the grand mean/median includes the value, as in "Grand median (56.2)". |
| Width = | width of line, in 1000'th inch units |
Stat_GroupInfo
Followed by:
Draw, Digits
where
| Draw = | Specifies which entries to draw in the upper left corner of each group. Combine the following settings: |
1 = mean (or median for median-based box-and-whisker plots)
2 = standard deviation (IQR for median-based box-and-whisker plots)
4 = coefficient of variation (%) (ignored for median-based plots)
8 = sample size
| Digits = | number of significant figures to use in numbers. |
Stat_LimitsAsCL
If followed by a non-zero entry, then the legend for all limits on mean-based plots will be shown as a percent confidence value rather than a multiplier for the standard error. This option has no effect if limits are a function of standard deviation (Stat_BWOptions StdDevorErr=0) rather than standard error.
Stat_MeanFormat
Followed by several options for how the mean or median is drawn on 1D statistics plots:
SymbolorLine, Style, Width, Symbol, Size, Color
where
SymbolorLine =
0 to draw the mean/median with a symbol, = 1 for a line segment
| Style = | line style used if SymbolorLine=1 to drawn mean/median |
1=solid line
2=long dash
3=dotted
4=dash dot
5=medium dash
6=dash dot dot
| Width = | line width used, in 1000'th inch units |
| Symbol = | symbol style to use if SymbolorLine=0. See symbol style codes above under Stat_DotOptions. |
| Size = | height of symbol, in 1000'th inch units |
| Color = | Red + Green*256 + Blue*65536, where all components range from 0 to 255. |
Stat_Outliers
Followed by options for if and how outliers and extremes are drawn:
Draw, Outlier_Symbol, Outlier_Color, Extreme_Symbol, Extreme_Color
where
| Draw = | 0 for no outliers or extremes, 1 to draw outliers, 2 to draw extremes but not outliers, 3 to draw outliers and extremes |
Outlier_Symbol =
Symbol style to use for outliers. See symbol style codes above under Stat_DotOptions.
Outlier_Color =
Color used for outlier symbols, red + green*256 + blue*65536
Extreme_Symbol =
Symbol style to use for extremes (styles defined above).
Extreme_Color =
Color used for extreme symbols, red + green*256 + blue*65536
Stat_PlotType
Followed by 0 for a box-and-whisker plot, or 1 for a dot graph.
Stat_RefLine
Adds a reference line to the plot, drawn across all groups. Followed by Draw, Value, Style, Width, Color on one line, Text on the next line. Each plot may have 2 reference lines. Add a second line by using two Stat_Refline entries, each with Draw=1.
| Draw = | 1 to draw the line, 0 if line should not be drawn. |
| Value = | Amplitude of the line |
| Style = | Line style to use for line 1=solid line 2=long dash 3=dotted 4=dash dot 5=medium dash 6=dash dot dot |
| Width = | Width of pen used to draw the line, in 1000'th inch units |
| Color = | Color of the line, red + green*256 + blue*65536 |
| Text = | Text that appears in the legend. Use "" for no legend entry. |
Stat_Rotated
If followed by a non-zero integer, the plot will be rotated such that groups are oriented from top to bottom along the vertical axis, amplitudes on the horizontal axis.
Stat_Whiskers
Followed by options defining the appearance of whiskers in box-and-whisker plots:
Option,Style, Width, Color
where
| Option = | Used only for median-based plots 0=whisker limits are expressed as a percentage 1=whiskers are drawn between non-outliers 2=whiskers include the entire data set. |
| Style = | Line style to use 1=solid line 2=long dash 3=dotted 4=dash dot 5=medium dash 6=dash dot dot |
| Width = | Width of pen used to draw whiskers, in 1000'th inch units. |
| Color = | Colors used for whiskers, red + green*256 + blue*65536 |
SymbolCycleColors
For XY plots, followed by the 1-based index of the curve for which symbol colors cycle through the color palette rather than using the curve color. Repeat as needed. If followed by -1, then ALL curves use this setting.
SymbolFrequency
Followed by the frequency of symbols (points per symbol). Default value is 1 (draw symbols at every data point). Applied to ALL curves.
SymbolFrequencyEx
Followed by a 1-based curve index and the symbol frequency for that curve.
SymbolOutlines
Followed by 1 to outline solid symbols in black, or 0 to draw symbols using a single color.
SymbolSizes
Followed by a list of symbol heights for each curve in the file, in thousandths of inches.
SymbolUnits
If followed by a non-zero number then symbol sizes are in Y units rather than a fixed physical size. If you zoom in on a plot with SymbolUnits set to 1, for example, then the symbols will be larger on the zoomed plot.
TickInterval
Followed by the tick mark interval on the X and Y axes (and Z in the case of 3D data). Alternatively, see "NumTicks".
Time Format
Time formatting string used for Calendar Date, Date/Time, and Time number formatting. Syntax is identical to that set with Windows Control Panel.
Title3
Followed by the third title line.
TopBarLabels (Obsolete, but currently supported. BarChartOptions is preferred)
Labels for bar charts will be drawn above the bar, rather than at the top of but inside the bar.
TransparentLegend
Turns off the default feature of hiding any objects that intersect the legend.
TriangleList
Used only for 3D surface plots consisting of random 3D points. DPlot will only save this information if one or more triangles have been deleted with Delete Triangles or Delete Thin Triangles. Followed by
NumTris, NumEdges
Vertex(1,1),Vertex(2,1),Vertex(3,1)
....
....
Vertex(1,NumTris),Vertex(2,NumTris),Vertex(3,NumTris),
EdgeVert(1,1),EdgeVert(2,1),EdgeTri(1)
....
....
EdgeVert(1,NumTris),EdgeVert(2,NumTris),EdgeTri(NumTris)
where
NumTris is the number of triangles
NumEdges is the number of edge segments at the outer extremity of the surface
Vertex is the 1-based index of a 3D data point
EdgeVert is the 1-based index of a 3D data point at one end of the edge segment.
EdgeTri is the 1-based index of the triangle for this edge.
Units
For tripartite plots and grain size distribution plots, scaling options allowing the use of user-defined units: the constants used to convert input values to values associated with a particular scaling option, and the labels associated with those constants. Followed by:
A, B
LabelA
LabelB
where
A, B are multipliers used to convert the user-defined units.
LabelA, LabelB are 16-byte character strings.
B and LabelB are ignored for grain size distribution plots.
wysiwyg
Turns on “What You See Is What You Get” style if the “Specify Plot Size” option of the Extents/Intervals /Size command is used.
X2Axis
Specifies a second X axis, whose tick marks and labels will be drawn at the top of the plot. Followed by:
A, B
X2AxisLabel
where
A,B = coefficients for a 1st order polynomial that translates primary X axis values to second X axis values.
X2AxisLabel = text drawn above the axis.
Y2Axis
Followed by a second Y axis label, to be placed along the right edge of the plot. Not displayed unless the Multiple Y Axes command is in effect.
YCutoff
Followed by Ylow, Yhigh. For XY plots, points with amplitudes outside these limits are ignored.
Stop
Forces DPlot to stop processing any other information in the file. This command is useful for developers who wish to add their own information to a DPlot file. DPlot will always add the line “stop” to the end of a DPlot file that it saves.
Page url:
https://www.dplot.com/help/index.htm?dplotfilemiscellaneousidentifiers.htm