|

  
|
||
|
|
||
Shown below is a description of the Generate plugin modules distributed with the licensed version of DPlot.
Please note the effect of Amplitude Limits: For all Generate plugins which produce new data within the same document (as opposed to replacing existing data or producing a new document), DPlot sends only the data that lies within those limits to the plugin, so points outside those limits are effectively ignored. This applies to all plugins distributed with DPlot version 2.3.2.3 or later and to all Version 4 plugins distributed by others. If this manipulation is undesirable (that is, you want to include points outside the limits), turn off Amplitude Limits before using these functions. For plugins that create a new document, all points are considered and the Amplitude Limits settings are applied to the new document. Note that this does not necessarily mean that points outside those limits are ignored, and they may effect the result depending on exactly what the plugin does. If you do not want any possibility of those points effecting the product, first delete them with the Clip Y command on the Edit menu.
Average Curve with Error Bars
Produces a new document with amplitudes equal to the mean of all Y values within a user-specified interval in X, and error bars with extents equal to either:
| • | the mean minus the extreme values, |
| • | the standard error for the points within the given interval, or |
| • | the standard deviation for the points within the given interval. |
As noted on the input screen, this function operates on individual curves only. If you want to operate on all curves producing a single resulting curve, then exit this dialog, select "Combine Curves" on the Edit menu, select all curves, uncheck "Keep originals", click OK, then return to this function.
Backbone Curve
Finds the points with maximum Y values within a specified interval on the X axis.
Baseline Shift
This routine differs from the Edit menu command of the same name in that it will automatically select the time at which the integral of the record should be zero. For explosive events this generally means finding the arrival time of the shock. This is a big time-saver for those involved in data processing, particularly if used in a macro with the RunPlugin command. The procedure is described in detail on the Baseline Shift web page.
Make Step Plot
Doubles the number of data points in a curve to give a stepped appearance. The original data will be replaced.
Monthly Peak
Useful for finding the peak monthly value within a time series (cumulative daily sales figures, for example).
More Curve Fits
This plugin is quite a bit more general than the least squares polynomial curve fits provided with the trial version of DPlot. This command allows you to fix one or more coefficients in the equation at a constant value, and also provides many more equation forms than a simple polynomial.
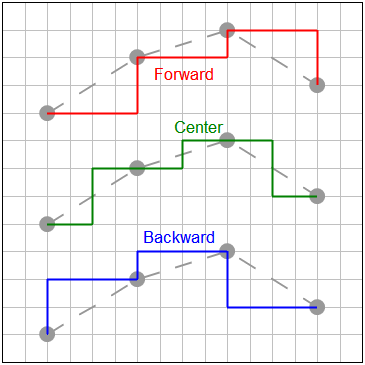
Moving Average
Choose from prior (identical to Excel's moving average feature), central, or cumulative. For more information see the blog entry.
Starting with DPlot version 2.3.2.1, if using this plugin with a RunPlugin command, you may specify options for that command and bypass the input dialog.
Syntax:
[RunPlugin("Moving Average","Curve number,Interval,Method,Tails")]
where
Curve number = 1-based curve index to operate on.
Method = 0 for prior moving average, 1 for central moving average, or 2 for cumulative moving average
Tails = non-zero to include data tails outside the limits of the interval
In an Excel VBA macro "[RunPlugin(""Moving Average"",""1,12,0,1"")]" will use the "prior" method on curve number 1 with an interval of 12 and include the tails (all points including the first 11).
Poincare Plot
Produces a new plot with X equal to the input Y and Y set to the next Y value in the curve. This operation is used to quantify self-similarity in processes.
Rank
Similar to Excel's RANK function, but the output (X) is the percentage of amplitudes in the input that are less than the input Y. Produces a new plot with Rank on the X axis and the original Y values left intact.
Split at Y=
Makes a copy of the input curve and sets values below (on the input) or above (on the copy) to user-specified Y values below or above these Amplitude Limits. One use of this feature is to subsequently use 2 different colors, line styles, or symbols on what was previously the same curve.
Page url:
https://www.dplot.com/help/index.htm?plugin_modules.htm