|
File Import Plugin Modules |

  
|
|
File Import Plugin Modules |
|
Plugin modules for file import are separate, optional components for DPlot. Programmers interested in developing their own plugin modules should read the Plugins for File Import, Export and Data Manipulation topic. File import plugins distributed with the full version of DPlot are described below.
AMO Transient Recorder files
Supports AMO Saturn Transient Recorder files.
ArcView Shapefile
Reads ArcView Shapefiles. A shapefile is a popular geospatial vector data format for geographic information systems software developed by ESRI. This plugin expects to find both a .SHP main file and .SHX index file with the same filename in the same directory. The plugin will automatically set Degrees, Minutes number formats for both the X and Y axes, insert nonsense Y=100 points between land masses, and set the scaling to Mercator projection, which in turn forces the Amplitude Limits setting on with limits of +/- 85 degrees (so that those previous nonsense points are ignored, and separate land masses will be drawn separately). If the file contains more than one entity and fewer than 100, you are given the option of reading the entire file into one curve or using one curve per entity.
Although DPlot will display longitudes as expected (-200° is displayed as 160°, for example), on input the data will be drawn with decreasing x values (longitudes) to increasing x values from left to right. Therefore if your map crosses longitude 180° and your input longitudes are positive in the Eastern hemisphere, negative in the Western hemisphere (as is standard practice), you will need to modify the longitudes for the map to be drawn correctly; otherwise you will get the entire range -180 to 180 degrees on the X axis. This change is easily accomplished with the Operate on X command on the Edit menu with X=IF(X>0,X-360,X). For example in this map:
the westernmost Aleutians are stored in the shapefile as positive longitudes. Without the edit mentioned above, the map would be drawn with the majority of the state at the left extreme of the plot and the westernmost Aleutians at the right extreme.)
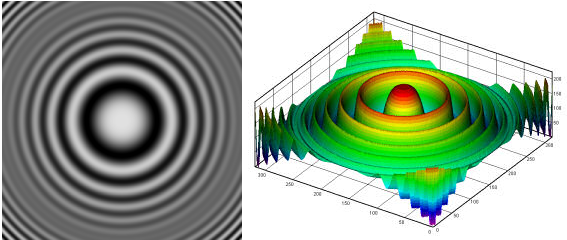
Bitmap to 3D
This plugin maps pixel values of 8-bit images to Z values in a surface plot. Non 8-bit images will be converted to 8-bit gray scale. Generally, gray scale images are stored with black as color 0, white as color 255. The plugin supports the most common bitmap formats: Windows bitmaps (BMP), Graphics Interchange Format (GIF), JPEG, Portble Network Graphics (PNG), Tagged Image File Format (TIF), and Targa (TGA) files.
NOTE: Bitmaps with distinct color bands (as you'd get with a screen capture of a DPlot plot) will result in stairstepped contour plots. For best results use bitmap images with a smooth gradation of shades.
Example:
|
Gould DAT files
Supports 8- and 16-bit data produced by most data loggers from Gould Instrument Systems (now defunct).
Hi-Techniques Win600 DAT files
Reads files produced by Hi-Techniques data acquisition systems.
LeCroy WavePro files
Reads files for the Lecroy WavePro line of oscilloscopes.
Raw data
Reads a file containing one or more data sets stored in the native binary format for the data type. Date consists of amplitudes (Y values) only. The plugin will generate X values starting at 0 with spacing determined by the "sample rate" entry. Data may be 1-, 2-, or 4-byte signed or unsigned integers or 4-byte (single precision) or 8-byte (double precision) floating point values in IEEE format. Both Intel little endian and Motorola big endian byte orders are supported. (Generally, software written for Apple computers and UNIX/Linux operating systems produces output with Motorola byte-ordering, while Windows programs generally use Intel byte order.)
Tektronix WFM files
Reads WFM files produced by most of the oscilloscopes from Tektronix.
WAV Audio
Reads Windows WAV files, 8- or 16-bit, mono or stereo, any valid recording rate. Input amplitudes are normalized to +/- 1.0. Stereo files result in 2 curves, mono in one curve.
Z Table
This plugin expects to read tabulated z values from an ASCII text file in the form:
z(x1,y1), z(x2,y1),..., z(xn,y1)
z(x1,y2), z(x2,y2),..., z(xn,y2)
...
z(x1,ym), z(x2,ym),..., z(xn,ym)
where n is the number of columns (x values) and m is the number of rows (y values). X and Y will be evenly-spaced and go from 0 to n-1 (X) and m-1 (Y). Data values may be separated by commas, spaces, or tabs.
Page url:
https://www.dplot.com/help/index.htm?file_import_plugin_modules.htm