|
EX01.GRF |

  
|
|
EX01.GRF |
|
To begin, open the file ex01.grf. Select File>Open, select DPlot file, then look in the DPlot folder for ex01.grf. Alternatively, you can open ex01.grf by double-clicking on the filename in Explorer and/or by dragging the file from Explorer to the DPlot window.
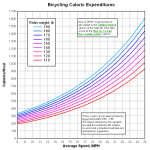
In the Note in the lower right you'll notice that these curves are all based on an equation, namely:
![]()
Rearranging,
![]()
So calories per hour per lb is given by:
![]()
and the calories per hour for a specific rider weight is:
![]()
Where W is the rider weight. We can use this equation to generate each of 9 curves shown in ex01.grf, substituting the actual rider weight for W. Select Generate>Y=f(X) and enter the values shown for "Y=", "From X", "To X" and "with interval dX" below (you can of course use whatever interval you'd like)

Repeat the above for 120, 130, ..., 190 lbs.
Attributes
Line/Symbol Styles
If you aren't happy with the line styles or weights (or symbol styles) used for the curves, click the Line/Symbol Styles button and make the changes you want. For more information on this command click here. You can also change line and/or symbol styles by right-clicking on a curve.
![]() Line/Symbol Styles button
Line/Symbol Styles button
Colors
Colors can be changed by clicking on the Colors button (or Options>Colors>Edit) or by right-clicking on a curve.
![]() Colors button
Colors button
For more information on colors for XY plots click here.
Text
Title and Axis Labels
Select Text>Title/Axes to enter the plot title and labels for the X and Y axes. If you mistype an entry after closing this dialog, just double-click on the label you want to change, or right-click on the label and select Edit text.
Legend
When using Y=f(X) or any of the Generate commands to produce a curve, the legend will automatically be assigned as the equation used to generate the curve. You can use the Legend/Labels command on the Text menu to change the legend. After closing this dialog, you can move the legend to the desired location by dragging it with your mouse. You can also double-click on a legend entry to edit the legend, or right-click on the legend to edit its attributes (framed, opaque, etc.)
Note
To enter a text notation, select Text>Add/Edit Note, or click the Note button.
![]() Note button
Note button
Click the Add Note button to create a new note. Enter each line of the notation, pressing <Enter> at the end of each line. The only aspect of this note that might require a bit of explanation is the subscripted 10 for the log operator. There are a number of methods to add the subscript attribute; here is the easiest: Enter this line w/o the subscript:
log10(Cal/min/lb)=V/25 - 1.85
then use your mouse to highlight the 10 and click the subscript button.
![]() subscript button.
subscript button.
This line of text will now look like:
log{\d10}(Cal/min/lb)=V/25 - 1.85
Close this dialog without checking Button activated. Why? You cannot move a button-activated note with your mouse. After using your mouse to drag the note to the desired location, if you want it to be button-activated right-click on it and select Button activated.
Scaling
The default scaling for any new XY plot is linear X, linear Y. You can change the scaling by right-clicking within the box surrounding the plot and selecting the scaling option from the drop-down menu. Due to the nature of the equation used to generate this plot, for example, linear X, logarithmic Y scaling will result in all curves appearing as straight lines. Scaling options are also accessible via the Linear/Log Scaling command on the Options menu.
Plot Size
The example is set up such that the box surrounding the plot is 7x7 inches (regardless of output device). Your plot probably fills the window at this point. If you want to specify a size, select Options>Extents/Intervals/Size, then check the Specify plot size box near the bottom of the dialog and enter whatever dimensions you'd like.
Alternatively, you can set the size of 2D plots by pointing the mouse cursor at a corner of the plot and dragging:
|
|
Dimensions will be shown in the units selected with the Default dimensions setting on the General command of the Options menu.
If you don't care for the default tick mark intervals, you can also change those in this dialog, as well.
Number Format
You will likely notice that the numbers along the Y axis ranging from 0 to 1700 or so do not use a 1000 separator. If you want to use a comma (or whatever character is specified as the 1000 separator with Control Panel) to delineate every 3rd digit, right-click on any number on the axis for which you want this change and select “More number format options...” and check the “Use 1000 separator” box. You can also right-click on those numbers to change the basic formatting of the numbers: powers of 10, engineering scales, multiples of PI, etc.

