|
ContourMethod macro command |

  
|
|
ContourMethod macro command |
|
Macro commands may be used either in macros or by sending the commands to DPlot via dynamic data exchange (DDE). Some commands are valid only in macros (noted by Macros Only). Commands sent to DPlot via DDE must be enclosed by square brackets [ ]. Macro commands should not include the brackets.
Command parameters shown in the descriptions below are placeholders for the actual values. Command parameters are either numeric values, equations that evaluate to numbers, or character strings. Character string parameters are always bound by double quotation marks. Equations must be preceded by an equals sign (=).
The pipe symbol (|) in the command syntax indicates that a parameter is optional, and should not be included in your macro unless otherwise noted.
All indices into arrays are 1-based, e.g. Curve1=1 refers to the first curve in a plot.
A 0x prefix for numbers in the descriptions below indicates hexadecimal notation; e.g. 0x0010 = 16.
![]() JR/Viewer indicates that the command is supported by DPlot Jr or DPlot Viewer.
JR/Viewer indicates that the command is supported by DPlot Jr or DPlot Viewer.
![]() JR/Viewer indicates that the command is NOT supported by DPlot Jr or DPlot Viewer.
JR/Viewer indicates that the command is NOT supported by DPlot Jr or DPlot Viewer.
[ContourMethod(drawmethod)] |
|
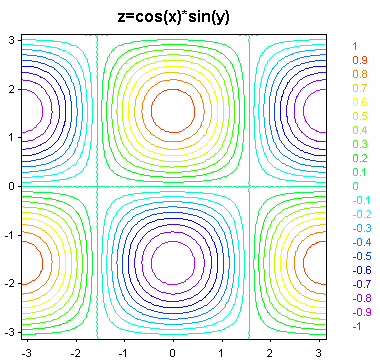
Sets the drawing type for 3D data to shaded bands for drawmethod=0, contour lines for drawmethod=1, waterfall plot for drawmethod=2, a wireframe mesh for drawmethod=3, a 3D bar chart for drawmethod=4, or a combination of shaded bands and contour lines for drawmethod=6. For waterfall, wireframe, and bar chart plots, Contour3D is forced to a 3D projection. For waterfall plots and bar charts, the data must be in the DATA_3D form (rectangular grid) rather than DATA_3DR (random 3D points). To produce an interpolated rectangular grid from random 3D points, use the GenerateMesh command.
Contour lines (drawmethod=1) and the shaded bands/contour lines combo (drawmethod=6) are only valid for 2D views. If a 3D view is in effect when either of these options is selected, the plot type is forced to shaded bands (drawmethod=0).
Examples:
[ContourMethod(1)] (2D views only)
[ContourMethod(2)]
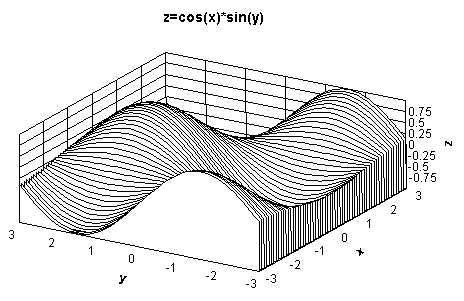
[ContourMethod(3)]

[ContourMethod(4)]
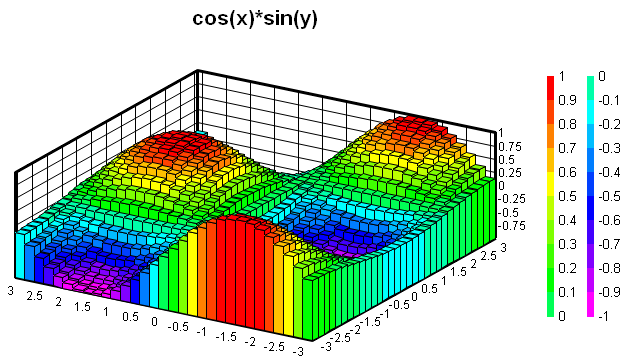
To set the individual bar widths, use ContourBarWidth.
[ContourMethod(6)] (2D views only)
____________________________
See also
Contour Options menu command
Page url:
https://www.dplot.com/help/index.htm?contourmethodcommand.htm