Giving multiple graphs the same box size
Posted: Fri Nov 30, 2018 10:55 am
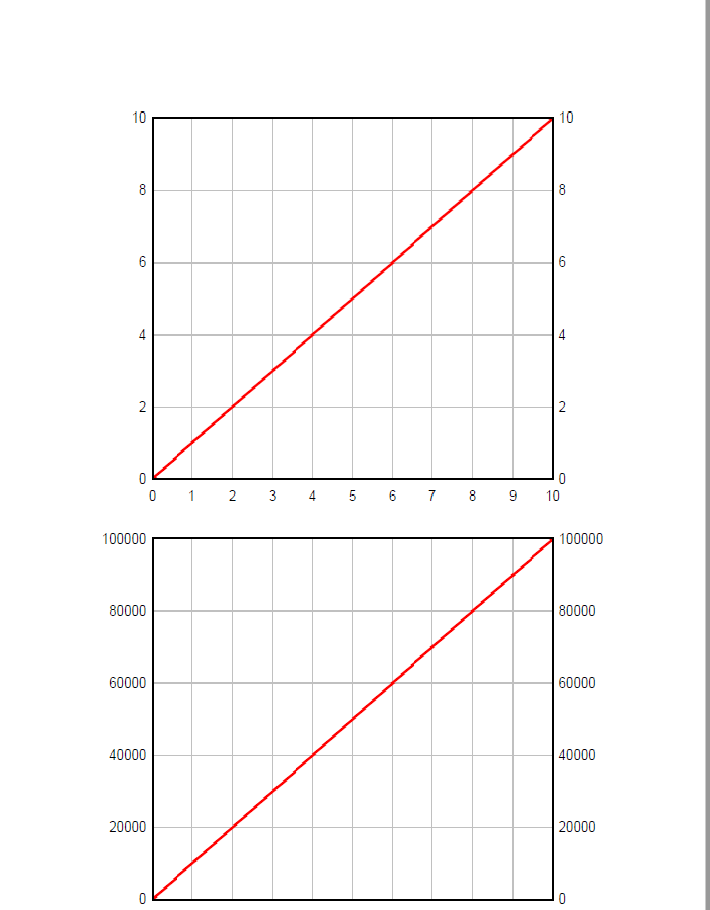
Hi- I have not found a way to create 2 or more graphs that have the same (a) size of the axis box and (b) font size. This is important for publication, when you need to make a single figure out of several graphs placed one above the other, aligned by the Y axes so that the X axis labels on the bottom plot align with the X axis tick marks on the plot above it.
The problem is when the Y axis labels are different sizes: for example if the bottom plot Y values range from 0 to 10 and the top plot values range from 0 to 100,000. When you set the size of a plot, DPlot adjusts the axes so that the whole plot, including axis labels, fits that size. So when the Y axis labels of two plots are different sizes, the plot boxes are no longer the same size. To make the axes align, you must shrink one of the plots, which gives it a different font size, which is unacceptable.
What I often need is to specify the size of the box defined by the two axes, so that multiple plots can be aligned by their axes while having the same font size, even though the total plot area will differ. Is there a way to do this? If not, it would be extremely helpful.
Steve R.
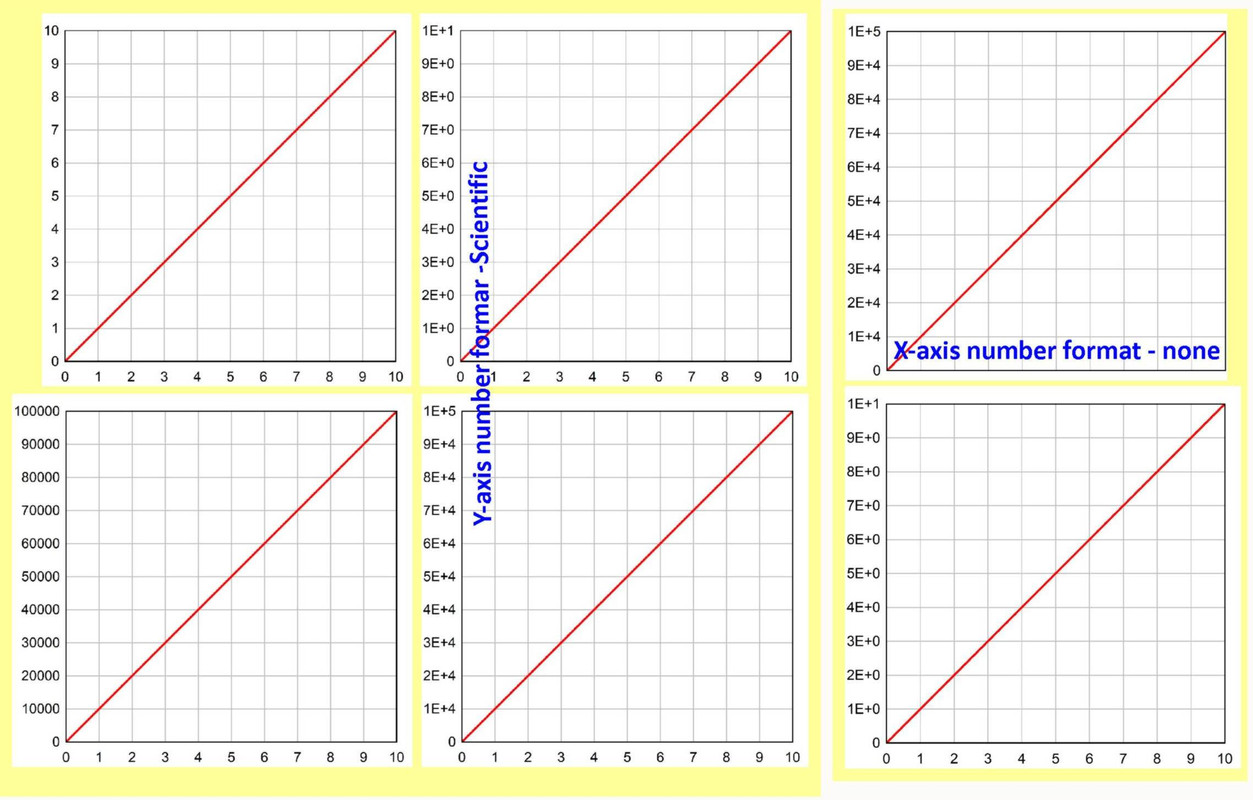