
Hi,
Somehow I cannot manage to realize replacing y-values by zeros using the operate on Y function.
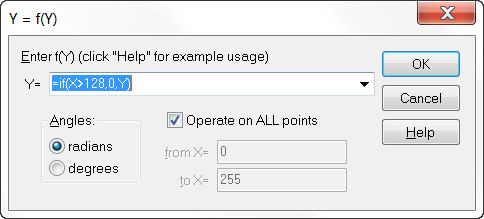
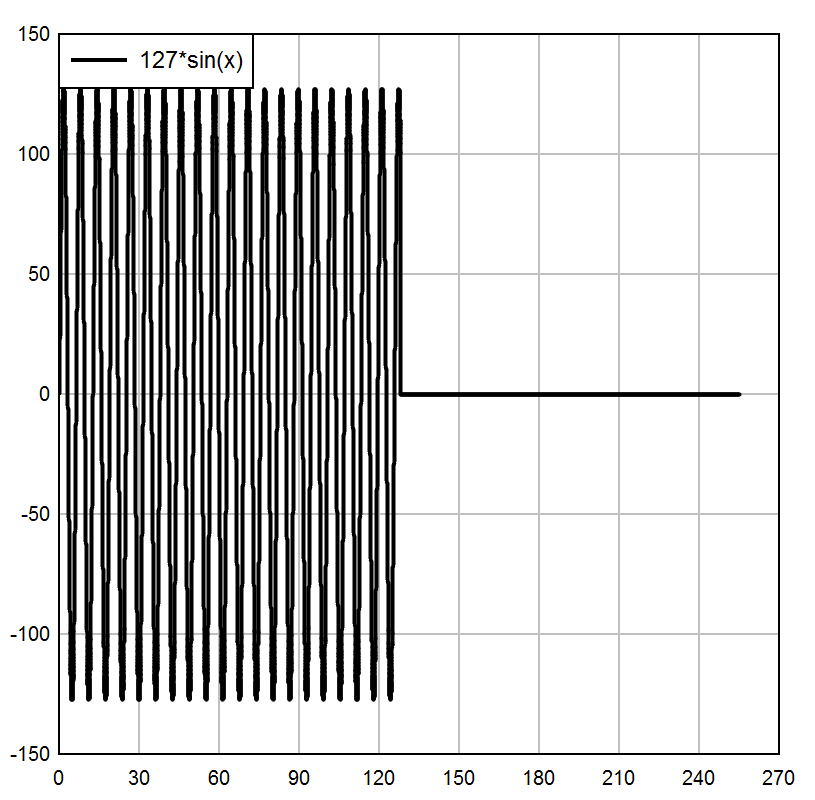
In a graph I want Y-values of the X-range larger than 128 to be zero.
Using the "operate on Y command I tried several varieties of the if-function like below but everything ends up in a "syntax error":
Y= if(X>128,0,Y*1)
Y= if(X>128,(0*Y),(Y*1))
Y= if(Y<0,0*Y,Y) (Y values happen to be negative when X>128; abused this coïncidence in the latter example)
etc.
I don't see what I'm doing anything different than the example in the help: if(x<5,x^2,(10-x)^2)
Can anyone help me with this one?
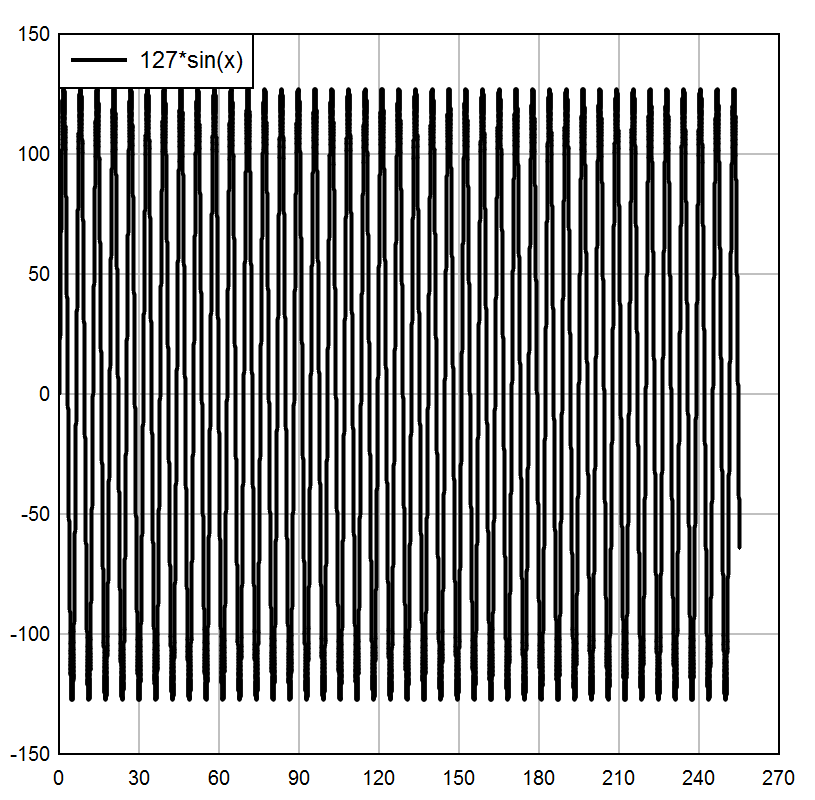
The orginal graph is a sine curve with X[0,255] and Y[-127,127]
Roberto
if function to assign zeros to y-values
-
DPlotAdmin

- Posts: 2312
- Joined: Tue Jun 24, 2003 9:34 pm
- Location: Vicksburg, Mississippi
- Contact:
I tried this just now and it worked as expected. Also "if(X>128,0,Y)" works. What version are you using?Y= if(X>128,0,Y*1)
Visualize Your Data
support@dplot.com
support@dplot.com
Really??!
Tried again and still syntax error. I'm using Dplot 2.3.5.3 which is the latest as far as I am aware of.
Adding the "=" before the if function doesn't help either (in the help example the "=" isn't used).
Also setting the "radians" option in the dialog does not do the trick.
Following an image of all info regarding this issue. Can you discover what I'm doing wrong, David?
Roberto
-
DPlotAdmin
- Posts: 2312
- Joined: Tue Jun 24, 2003 9:34 pm
- Location: Vicksburg, Mississippi
- Contact:
I'm at a loss presently, sorry. The leading equals sign is redundant and is removed before the equation is ever evaluated. It looked like you might have a space between ">" and "128" (and it would have been embarrassing if that was the problem), but I tried one and then several spaces and it worked as expected.
The only thing I can think of at the moment is there's a problem with internationalization and interpreting a comma as a decimal point. But I'll be surprised if that's it. What country do you reside in?
The only thing I can think of at the moment is there's a problem with internationalization and interpreting a comma as a decimal point. But I'll be surprised if that's it. What country do you reside in?
Visualize Your Data
support@dplot.com
support@dplot.com
Netherlands is my location.
(PS: guess you overlooked the location being mentioned on the left of the posted messages )
)
Number 10,95
Large Number 10.000,95
(opposite of English: dots between integers, comma before fraction)
If I use dots instead of commas in the if expression still an error message.
------------------
I un- and reïnstalled DPlot using the backup copy I had.
Experimenting a bit with other (operate on) Y=f(X) expressions and the Decimal Point set option in Options I got interesting results. Looks indeeds like your hunch was in the right direction:

Notice the dots in the expression history! "Without" any reason they changed to comma's !
-------------
I cannot download a replacement installer for DPlot telling me there are no updates.
If you think it might help, could you please send me the latest release to roberto@romus.nl ? Long shot but my copy of DPlot might be corrupted eventhough a corrupted file likely would cause much more severe issues.
(PS: guess you overlooked the location being mentioned on the left of the posted messages
Number 10,95
Large Number 10.000,95
(opposite of English: dots between integers, comma before fraction)
If I use dots instead of commas in the if expression still an error message.
------------------
I un- and reïnstalled DPlot using the backup copy I had.
Experimenting a bit with other (operate on) Y=f(X) expressions and the Decimal Point set option in Options I got interesting results. Looks indeeds like your hunch was in the right direction:
Notice the dots in the expression history! "Without" any reason they changed to comma's !
-------------
I cannot download a replacement installer for DPlot telling me there are no updates.
If you think it might help, could you please send me the latest release to roberto@romus.nl ? Long shot but my copy of DPlot might be corrupted eventhough a corrupted file likely would cause much more severe issues.
Roberto
-
DPlotAdmin
- Posts: 2312
- Joined: Tue Jun 24, 2003 9:34 pm
- Location: Vicksburg, Mississippi
- Contact:
You have the latest version already. I'll play around with commas and decimal points and figure this out. I think what likely happened is that older versions did NOT (regardless of your internationalization settings) see a comma as a decimal separator, but the current version will.
Visualize Your Data
support@dplot.com
support@dplot.com