| View previous topic :: View next topic |
| Author |
Message |
periksen
Joined: 21 Dec 2010
Posts: 1
|
 Posted: Tue Dec 21, 2010 6:56 am Post subject: How do I create a contour plot with transperant background? Posted: Tue Dec 21, 2010 6:56 am Post subject: How do I create a contour plot with transperant background? |
 |
|
Hi, I am new to dPlot, having purchased it today.
It is working brilliantly so far except for one small issue: I want to create a contour plot with a transperant background. How do I do this, please?
I want to overlay pollution contours (created with dPlot from an XYZ file) on Google Earth (using a KML file for placement in a LatLon box at the appropriate location).
At the moment the contour plot obscures the Google Earth image unless I edit it to make the JPG image saved from dPlot partially transparent in an external video editing program. It would better if the original image saved from dPlot didn't have anything 'between' the contours, if that is possible. Perhaps the problem is that I am saving to JPG format ... would another format work better and if so, what format? Or is there some setting somewhere in dPlot that will allow a fully transparent background with just the contour lines visible?
Grateful for an answer to this question.
Thanks - Peter Eriksen, Melbourne Australia |
|
| Back to top |
|
 |
DPlotAdmin
Site Admin

Joined: 24 Jun 2003
Posts: 2310
Location: Vicksburg, Mississippi
|
| Posted: Tue Dec 21, 2010 8:39 am Post subject: |
|
|
I'm not sure if Google Earth will allow you to import a metafile - if it does then that format will work much better than any of the bitmap formats. (The background isn't drawn in metafiles.) I'll try to look into this later today.
There is no way in DPlot to specify a transparent background. If you're stuck using a bitmap image, then your best choices would be GIF or PNG. Then open the image in your favorite editor and make the background color transparent (if your editor will do that) or (in PaintShop Pro, for example) select all of the background, invert the selection, copy, then paste to a new image.
You might prefer to go the other way: do a screen capture of Google Earth, crop the image as desired in your editor, then use that as the background in DPlot. See http://www.dplot.com/blog/2010/05/background-images.html for an example.
_________________
Visualize Your Data
support@dplot.com |
|
| Back to top |
|
|
DPlotAdmin
Site Admin
Joined: 24 Jun 2003
Posts: 2310
Location: Vicksburg, Mississippi
|
| Posted: Tue Dec 21, 2010 2:03 pm Post subject: |
|
|
The short version on metafiles is Google Earth won't import them, so that option is unfortunately out.
I'll be working on the PNG and GIF export plugins to allow you to set the plot background color to transparent when saving as an 8-bit image. The trouble with this is the same you'll have with modifying the image in an editor: Antialiasing should be turned off, else you'll get grey artifacts along the edges of each line segment, and text using the default Windows antialiasing options looks awful, for the same reason.
Until the changes to those plugins are done, you can manually do this with, for example, PaintShop Pro. (I'm certain Photoshop will also do this but don't have a copy handy.) In DPlot turn off antialiasing under Options>General. You'll probably want to set the number format along the X and Y axes to "None", and get rid of most text (title lines, legend, etc.). Save the plot to an 8-bit PNG or GIF.
Open that file in PaintShop Pro and select File>Save As. Click the "Options" button, then "Run Optimizer". On the next screen click on the Transparency tab. Select "Single color transparency" and "Areas that match this color", then with the eye-dropper click on a background area on the image. Click OK a few times and you're done.
Here's one result (scaled down 50%):
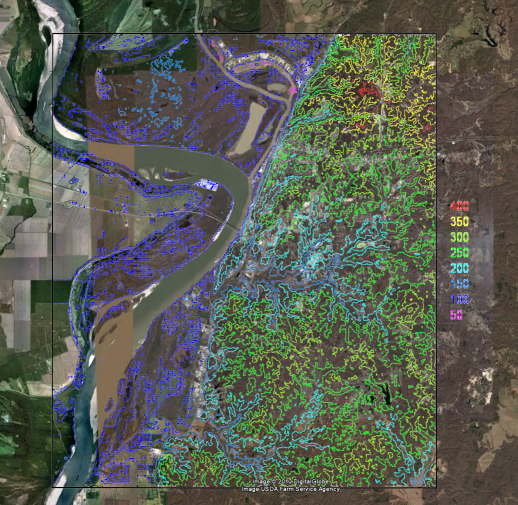
The full size image (~2Mb) is here:
http://www.dplot.com/forumimages/google_earth_overlay.png
I left the legend in place just to show what I was talking about with the antialiased text. Short of changing the Windows-wide setting for screen fonts, one option that might not be too bad would be to set the plot and window background colors (in DPlot) to an average color for the legend location in Google Earth.
_________________
Visualize Your Data
support@dplot.com |
|
| Back to top |
|
|
DPlotAdmin
Site Admin
Joined: 24 Jun 2003
Posts: 2310
Location: Vicksburg, Mississippi
|
| Posted: Tue Dec 21, 2010 7:16 pm Post subject: |
|
|
This falls under the category of "Coming soon". Version 2.3.0.5 will have a new "Transparent background" setting for GIF and 8-bit PNG output. If selected, DPlot will temporarily turn off your system's "Smooth screen fonts" and/or ClearType settings so that text isn't quite as ugly as in the previous example. Here's the same example referenced in the last post, image created with the not-yet-available "Transparent background" setting checked:
http://www.dplot.com/forumimages/google_earth_overlay_new.png
It still isn't perfect with text. Even with "Smooth screen fonts" turned off, text is still not drawn in a single color. At the moment I have no idea why. If you zoom in on the legend you'll see some antialiasing in the text even though all antialiasing features are turned off. (Of course if you remove all text then this becomes irrelevant.)
Still, pretty cool, sez me  . Thanks for the suggestion. . Thanks for the suggestion.
_________________
Visualize Your Data
support@dplot.com |
|
| Back to top |
|
|
DPlotAdmin
Site Admin
Joined: 24 Jun 2003
Posts: 2310
Location: Vicksburg, Mississippi
|
| Posted: Wed Dec 22, 2010 8:03 pm Post subject: |
|
|
One more round, before this gets turned loose on the world:
http://www.dplot.com/forumimages/google_earth_overlay_newer.png
The unexplained white text edges in the previous example in Google Earth was due to how that app resamples images: when importing an 8-bit image, Google Earth resamples the image when resizing (which will almost always be necessary) so that pixels are blended with the background color, even though that background color should be completely transparent. If the imported image is 32-bit, though, this resampling does not take place (as far as I can tell). So for "Transparent background", the super secret version of DPlot saves the image to 32-bits with an alpha channel for PNG images. The only gotcha on what the next version of DPlot is doing is forcing "Smooth screen fonts" off, which as far as I can tell is necessary, but results in jaggies with the text. I'm looking into it, but this may be a dead end and the above is the best you'll be able to do. Coming soon...
_________________
Visualize Your Data
support@dplot.com |
|
| Back to top |
|
|
DPlotAdmin
Site Admin
Joined: 24 Jun 2003
Posts: 2310
Location: Vicksburg, Mississippi
|
| Posted: Tue Dec 28, 2010 5:18 pm Post subject: |
|
|
One more time, and I think this time is a keeper. There are now (on my system only) two options for transparency: 8-bit GIF, which is similar to previous images and works well enough, but gives up antialiasing in line segments, symbols, and text. And as of a few minutes ago, 32-bit PNG with an alpha channel. Here's an example of the new 32-bit PNG output:
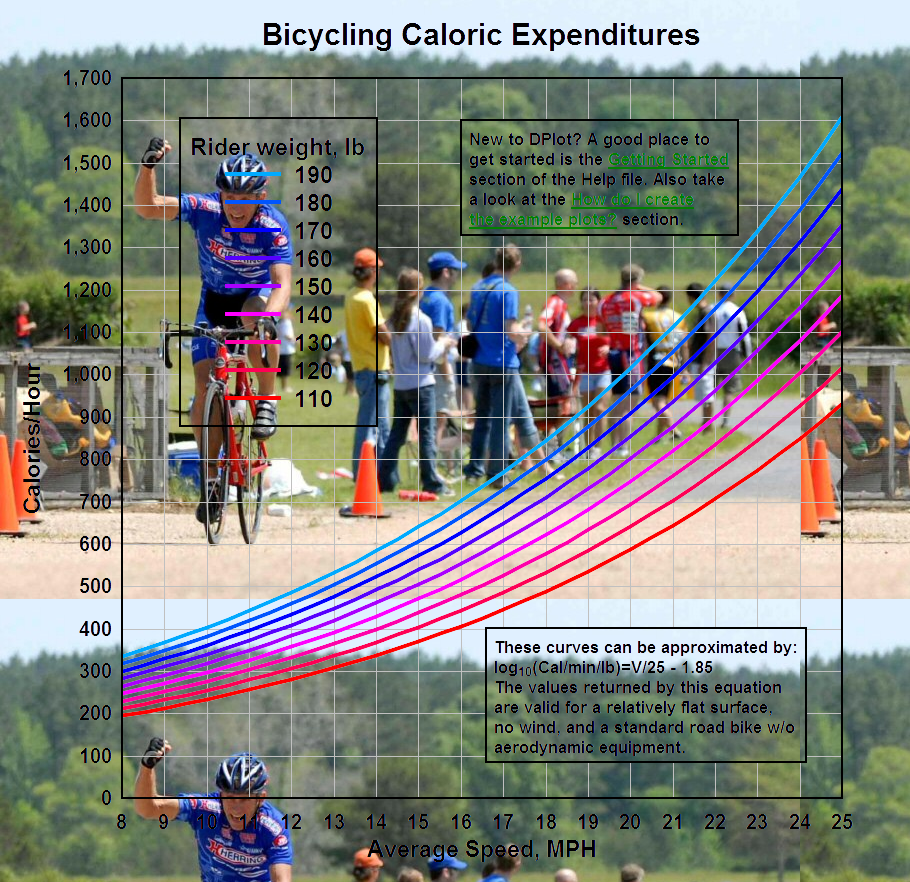
As far as I can tell this is perfect. All antialiasing is preserved. The green text doesn't look very good, but that's more a function of the background that it is drawn on than what DPlot does with it. All of this will be available in the next release, coming in 2010 barring horrible bug reports.
For other developers interested in the hoops required to jump through here, DPlot creates two HBITMAP images, one normal and one with the background colors forced to white and all other colors forced to black. That B&W bitmap (actually greyscale because of antialiasing) is converted to an 8-bit greyscale image, inverted with FreeImage_Invert, and then combined with the other bitmap using FreeImage's FreeImage_SetChannel function with channel set to FICC_ALPHA. Of course this is mostly meaningless if you don't already use FreeImage. If you don't and think you have a need for this, it is highly recommended by me: http://freeimage.sourceforge.net/. All image export options offered by DPlot (BMP, GIF, JPG, PNG, TIF) use FreeImage functions.
_________________
Visualize Your Data
support@dplot.com |
|
| Back to top |
|
|
DPlotAdmin
Site Admin
Joined: 24 Jun 2003
Posts: 2310
Location: Vicksburg, Mississippi
|
| Posted: Wed Dec 29, 2010 12:45 pm Post subject: |
|
|
| Quote: | | As far as I can tell this is perfect. |
Ugghh! It only appeared perfect through my rose-colored glasses. The last effort looked decent enough on a laptop with ClearType fonts on a low-saturation background, but looked really bad with the Windows "Standard" antialiasing for fonts. And antialiased line segments and symbols also didn't look very good if you zoomed in and are as persnickety as I am. The trouble is there are no transparency-aware versions of Windows GDI functions for graphic primitives (text, line segments, fills, etc.) The object has to be drawn on something. The previous example created an alpha channel which minimized the problem, but it was already too late: text was drawn on a solid background, so the antialiased pixel colors were based on whatever the background was.
At this point I see no option but to turn off all antialiasing, text included. Here's the result:
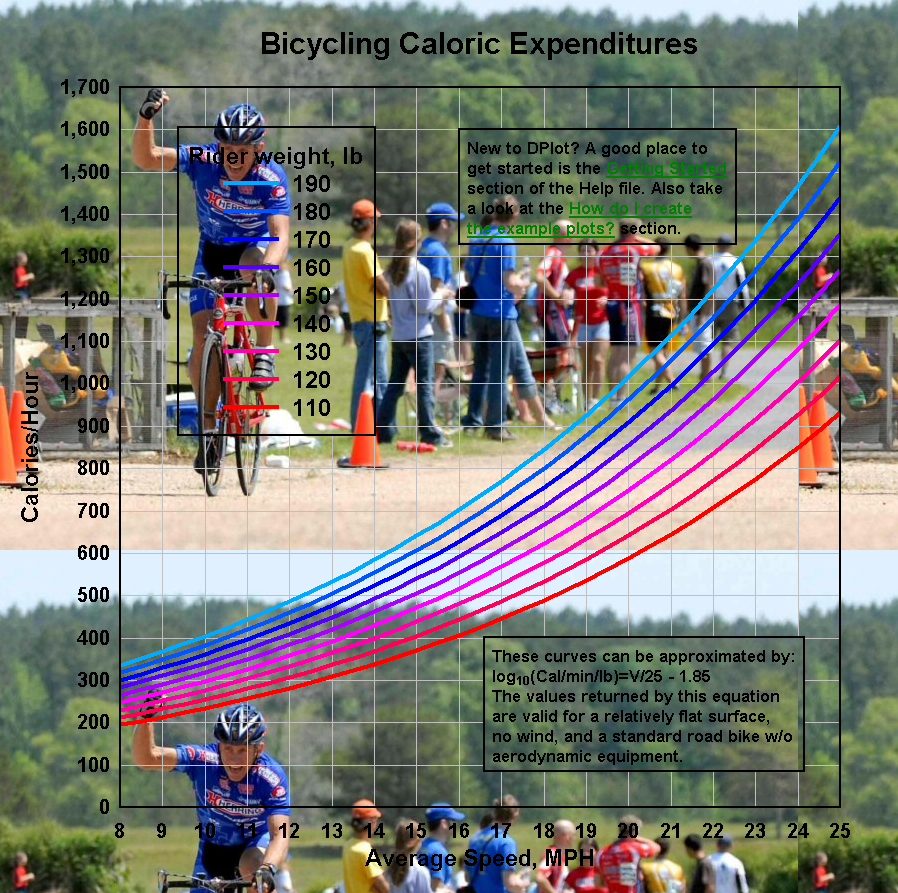
And this one actually is perfect at what it does, though the aliasing problem bugs me. Note that the reverse situation (importing a background into DPlot) doesn't have this problem, since the background is drawn first and all antialiased objects are drawn on top of that background, taking the background into account. For example:
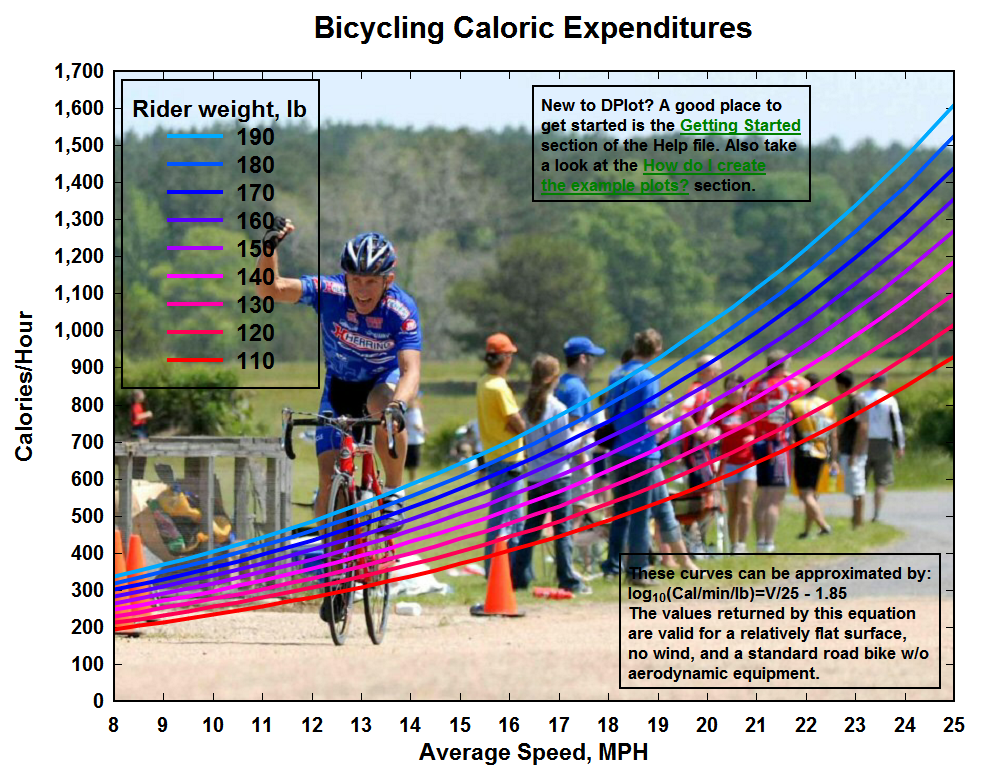
Lest I'm accused of stacking the deck here: Yes, the legend and note backgrounds are transparent and grid lines are not used. That's intentional, because it just looks better (in this case). Keep in mind that with this image there is no magic going on in the background related to background color: what you see on the screen is what you'll get in the saved image. The main point of this image is that antialiased text and lines are perfect. Zoom in if you don't believe me
_________________
Visualize Your Data
support@dplot.com
Last edited by DPlotAdmin on Thu Dec 30, 2010 1:24 pm; edited 1 time in total |
|
| Back to top |
|
|
jsc
Joined: 02 Dec 2005
Posts: 222
|
| Posted: Thu Dec 30, 2010 12:09 pm Post subject: |
|
|
David,
Looks good. But speaking of FreeImage, the version in the latest DPlot package isn't the latest. 3.14.1 from August 12,2010 seems to work okay in DPlot, but I'm wondering if you want to check it before you release this new feature. |
|
| Back to top |
|
|
DPlotAdmin
Site Admin
Joined: 24 Jun 2003
Posts: 2310
Location: Vicksburg, Mississippi
|
| Posted: Thu Dec 30, 2010 1:04 pm Post subject: |
|
|
Jon,
With all of my tests I ended up using the latest version of FreeImage because some functions I wanted aren't included in earlier versions. Those functions ended up not being used, but there's no reason I've found not to include the newest version of FreeImage. So I plan to do that. And I'll also look into whether the default 8-bit quantization has been improved, as my suggestions with older versions confuse even me!
_________________
Visualize Your Data
support@dplot.com |
|
| Back to top |
|
|
|
|
You cannot post new topics in this forum
You cannot reply to topics in this forum
You cannot edit your posts in this forum
You cannot delete your posts in this forum
You cannot vote in polls in this forum
|
Powered by phpBB © 2001, 2005 phpBB Group
|

