| View previous topic :: View next topic |
| Author |
Message |
raydela
Joined: 10 Sep 2003
Posts: 46
Location: Oxford, MI, USA
|
 Posted: Fri Oct 08, 2010 12:19 pm Post subject: Conditional Curve Color for 2D Y=F(X,Y1,Y2,...) Plots Posted: Fri Oct 08, 2010 12:19 pm Post subject: Conditional Curve Color for 2D Y=F(X,Y1,Y2,...) Plots |
 |
|
Here's a suggestion for a new feature: Provide ability to define a Y-value threshold for a curve below which one color is plotted and above which another color is plotted.
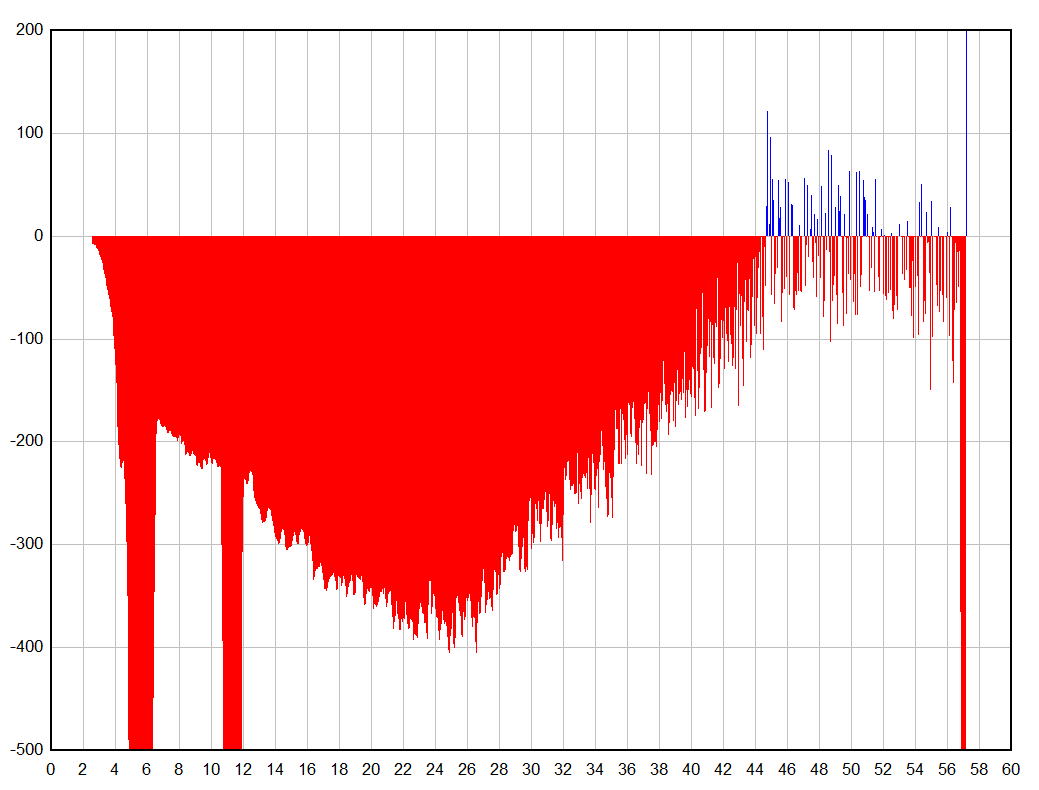
A colleague of mine for whom I generated 2D curves X, Y1, Y2, and (Y1-Y2) wanted to more clearly see when the derived curve, the difference between the data sets (Y1-Y2), went above and below the threshold value (which in this case was simply 0, but it could have been some "grid unfriendly" value requiring manually drawing a line from Y-axis across the page).
I was able to display this using two plots and conditional "IF((Y1-Y2)<0,(Y1-Y2),0) and "IF((Y1-Y2)>0,(Y1-Y2),0)" each assigned a different color. However, the false condition draws a 'flatline' which is what I want to make disappear.
Or as a compromise to providing a SINGLE CURVE the ability to plot one of two colors conditionally, provide a SYMBOLIC way to indicate "NO PLOTTING" in place of the true or false condition
Example using string "#@#" to mean "NO PLOTTING".
"IF((Y1-Y2)>threshold value, (Y1-Y2), #@#)" means if condition is false then don't plot the data.
"IF((Y1-Y2)>threshold value, #@#, (Y1-Y2))" means if condition is true then don't plot the data.
This way one can use the TWO CURVE method to obtain the same result (and probably cause less pain in modifying DPlot code).
Ray Delaforce |
|
| Back to top |
|
 |
DPlotAdmin
Site Admin

Joined: 24 Jun 2003
Posts: 2311
Location: Vicksburg, Mississippi
|
| Posted: Fri Oct 08, 2010 3:21 pm Post subject: |
|
|
| Quote: | Example using string "#@#" to mean "NO PLOTTING".
"IF((Y1-Y2)>threshold value, (Y1-Y2), #@#)" means if condition is false then don't plot the data.
"IF((Y1-Y2)>threshold value, #@#, (Y1-Y2))" means if condition is true then don't plot the data.
|
You can do this now with one extra step. If your Y range is A<Y<B, use
IF((Y1-Y2)>threshold value, (Y1-Y2), B)
IF((Y1-Y2)>threshold value, B, (Y1-Y2))
then select Options>Amplitude Limits, check "Enable", and enter A & B for the limits.
Good idea in general, though. I'll add it to my to-do list.
_________________
Visualize Your Data
support@dplot.com |
|
| Back to top |
|
|
raydela
Joined: 10 Sep 2003
Posts: 46
Location: Oxford, MI, USA
|
| Posted: Sat Oct 09, 2010 11:00 pm Post subject: |
|
|
I tested your method and got the desired result - illusion of a single curve which cleanly makes the color transition(s) with no artifact lines (the false condition value plotted as a 'flatline')
Regarding your to-do list, do you mean providing what essentially would be a 'lift-pen' command string to use in the conditional expression to simplify things a bit?
Then again, a 'lift-pen' command would also allow rescaling the range of a graph without the worry that the new range happens to be within the threshold value (which was chosen to be outside of the original amplitude range) resulting in vertical lines where nothing should be plotted.
Thanks again,
Ray Delaforce |
|
| Back to top |
|
|
DPlotAdmin
Site Admin
Joined: 24 Jun 2003
Posts: 2311
Location: Vicksburg, Mississippi
|
| Posted: Sun Oct 10, 2010 9:27 am Post subject: |
|
|
Ray,
Thanks for the e-mailed examples. My suggestion with "Amplitude Limits" didn't work nearly as well as I had pictured in my head. If you had additional points where the curve crosses 0 then it would be OK. One way you can fairly easily do that is to create a new curve with endpoints at (0,0) and (60,0) (in the example you sent), then use Info>Find Intersections on your original curve and this Y=0 line, with "Insert new data points at intersections" checked. Then proceed as before.
This isn't what you asked for, but something else you might consider is "Fill Between Curves" with the 2nd "curve" set to "Fill to Y reference line", with Yref=0:
| Quote: | | Regarding your to-do list, do you mean providing what essentially would be a 'lift-pen' command string to use in the conditional expression to simplify things a bit? |
I was thinking more of switching colors based on Y, using only 1 curve.
_________________
Visualize Your Data
support@dplot.com |
|
| Back to top |
|
|
DPlotAdmin
Site Admin
Joined: 24 Jun 2003
Posts: 2311
Location: Vicksburg, Mississippi
|
| Posted: Sun Oct 10, 2010 11:44 am Post subject: |
|
|
See how you like this when you get a chance.
Exit DPlot if it is running.
Download http://www.dplot.com/plugins/generate/split.dll and save to <dplot folder>\plugins\generate.
The next time you run DPlot you'll see a "Split at Y=" command on the Generate menu.
What this does:
1) Prompts you for the Y value where you want to split the curve, and a Ylow and Yhigh value that will be used w/ Amplitude Limits.
2) Copies your input to a new array, inserting interpolated points at Y=split value where necessary.
3) Replaces the input curve with this new array, with any Y values < the split value set to Ylow minus a small number.
4) Creates a new curve from this new array, with any Y values > the split value set to Yhigh plus a small number.
5) Turns on the "Amplitude Limits" feature using Ylow and Yhigh.
I need to add some error-checking to this, but it should work with just about any data as long as you don't do things to intentionally break it (like set the high value to less than the low value).
I should probably be smarter and automatically pick a Ylow and Yhigh value based on the current extents, but that may be getting too cute. As you already mentioned, this would break if you did something to modify the extents (add a new curve, multiply all Y's by a constant, etc.)
_________________
Visualize Your Data
support@dplot.com |
|
| Back to top |
|
|
DPlotAdmin
Site Admin
Joined: 24 Jun 2003
Posts: 2311
Location: Vicksburg, Mississippi
|
| Posted: Sun Oct 10, 2010 6:26 pm Post subject: |
|
|
| Quote: | | I should probably be smarter... |
I think this is me being smarter. Link is the same: http://www.dplot.com/plugins/generate/split.dll
The difference is the previous version's default Ylow and Yhigh were those stored from the previous run. In this version the plugin examines the actual extents of the current plot and sets Ylow to Ymin-(Ymax-Ymin) and Yhigh to Ymax+(Ymax-Ymin), which will definitely work with your current plot. Also added an explanatory note:
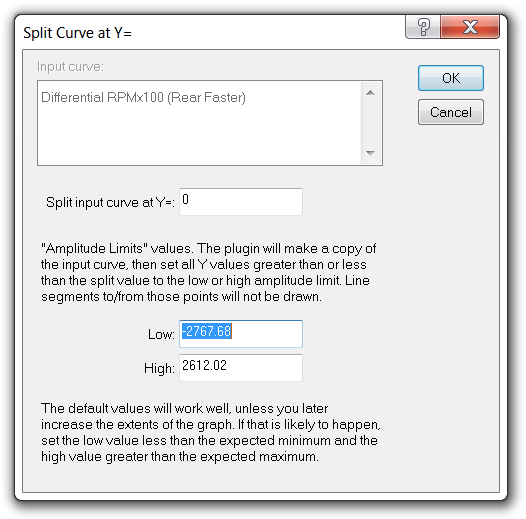
Let me know if you have any questions or problems.
_________________
Visualize Your Data
support@dplot.com |
|
| Back to top |
|
|
jsc
Joined: 02 Dec 2005
Posts: 222
|
| Posted: Mon Oct 11, 2010 7:04 am Post subject: |
|
|
David,
Just testing out your new split dll. Thanks - it will be handy.
For some reason the last lines of both blocks of text are clipped off as if the box that it is supposed to fit is too small. On my screen, I need 5 lines of text for both boxes, but on your screen shot above it only takes 4 lines. My box is narrower than yours as well (which must be why it's taking 5 lines, not 4.
This is XPPRo with the old-fashion classic look, ie, no "theme". |
|
| Back to top |
|
|
DPlotAdmin
Site Admin
Joined: 24 Jun 2003
Posts: 2311
Location: Vicksburg, Mississippi
|
| Posted: Mon Oct 11, 2010 7:51 am Post subject: |
|
|
Thanks for the info. Most likely a difference in default font sizes. Whatever - that's an easy fix.
_________________
Visualize Your Data
support@dplot.com |
|
| Back to top |
|
|
raydela
Joined: 10 Sep 2003
Posts: 46
Location: Oxford, MI, USA
|
| Posted: Mon Oct 11, 2010 10:23 am Post subject: |
|
|
Yes, I see the same cutoff help text for the "Split at Y=" (and I too am using WinXP). I also was able to crash DPlot (in the form of silent close of application) by selecting one of my two curves generated from recorded data.
However, the main item I wanted to mention is that the newly generated curve from split feature does not show up on either the legend or Options|Colors|Edit... window. Probably should give it some default text to remind the user to edit and give some meaning the both colors of the split curve.
One comment about fill method (which is nice suggestion too) for dual color curve when using two curve method: I found that the threshold and out-of-range need to have the opposite sign. For the following example the threshold is <0 or >0 and out-of-range 4000 or -4000, respectively:
if((Y1-Y2)<0,100*(Y1-Y2),4000) [UNCHECK "Color Above Yref"(=0)]
if((Y1-Y2)>0,100*(Y1-Y2),-4000) [UNCHECK "Color Below Yref"(=0)]
I just checked out using fill when a curve is split and it looks like you already took care of this detail. One just has to use the proper "Color Above Yref" or "Color Below Yref" for each part of the split.
Now all I need for Y=f(X,Y1,Y2...) is entry of "100*(Y1-Y2)" and split does the rest. VERY NICE!
Ray Delaforce |
|
| Back to top |
|
|
DPlotAdmin
Site Admin
Joined: 24 Jun 2003
Posts: 2311
Location: Vicksburg, Mississippi
|
| Posted: Mon Oct 11, 2010 11:26 am Post subject: |
|
|
| Quote: | | I also was able to crash DPlot (in the form of silent close of application) by selecting one of my two curves generated from recorded data. |
If you can send me a file I'd appreciate it.
_________________
Visualize Your Data
support@dplot.com |
|
| Back to top |
|
|
raydela
Joined: 10 Sep 2003
Posts: 46
Location: Oxford, MI, USA
|
| Posted: Mon Oct 18, 2010 6:40 am Post subject: |
|
|
David,
I tried to reproduce the crash with several of the same data files I plotted during development of 'split' but have not been able to recreate it.
I'm can't remember if I used the first split.dll before I downloaded the 2nd version. Maybe the crash occurred with the first version of the dll.
If it happens again I'll send the file(s) (data source and grf).
Sorry I did not pay enough attention at the time.
Ray D. |
|
| Back to top |
|
|
|
|
You cannot post new topics in this forum
You cannot reply to topics in this forum
You cannot edit your posts in this forum
You cannot delete your posts in this forum
You cannot vote in polls in this forum
|
Powered by phpBB © 2001, 2005 phpBB Group
|

