Hi- I have not found a way to create 2 or more graphs that have the same (a) size of the axis box and (b) font size. This is important for publication, when you need to make a single figure out of several graphs placed one above the other, aligned by the Y axes so that the X axis labels on the bottom plot align with the X axis tick marks on the plot above it.
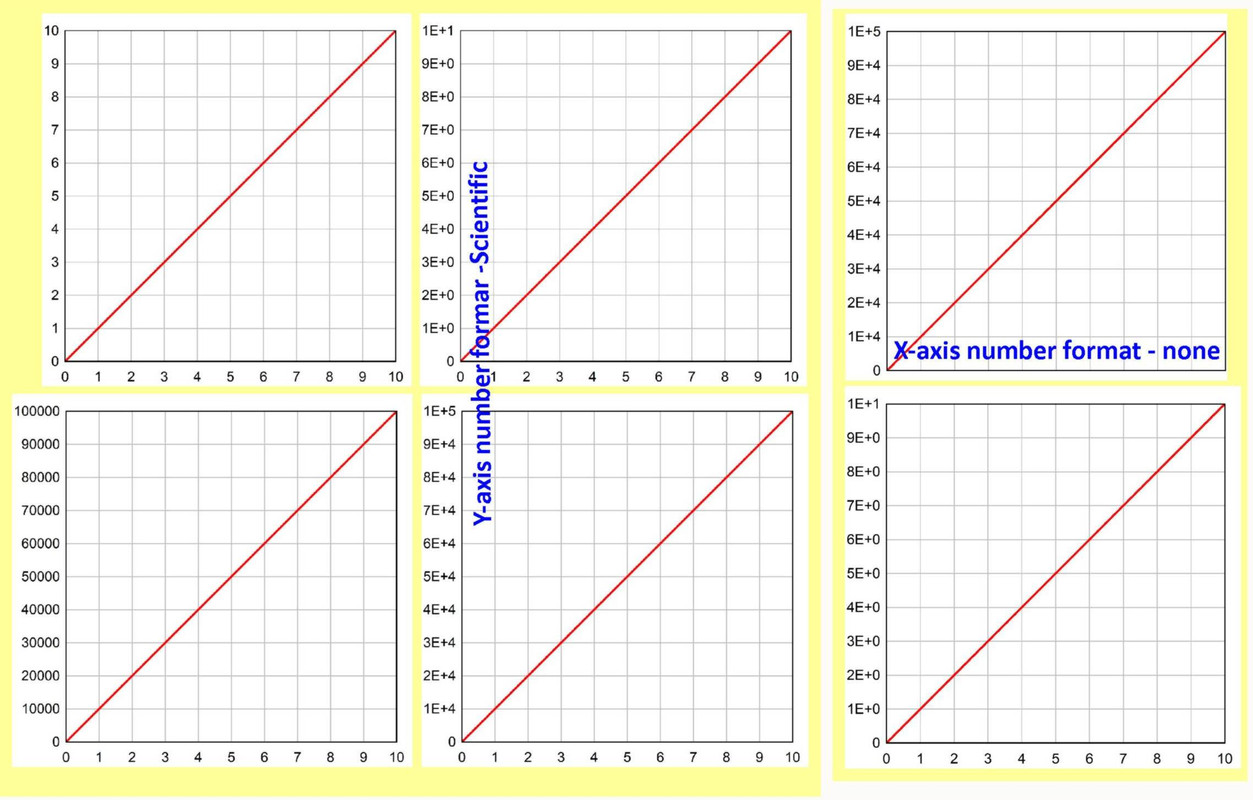
The problem is when the Y axis labels are different sizes: for example if the bottom plot Y values range from 0 to 10 and the top plot values range from 0 to 100,000. When you set the size of a plot, DPlot adjusts the axes so that the whole plot, including axis labels, fits that size. So when the Y axis labels of two plots are different sizes, the plot boxes are no longer the same size. To make the axes align, you must shrink one of the plots, which gives it a different font size, which is unacceptable.
What I often need is to specify the size of the box defined by the two axes, so that multiple plots can be aligned by their axes while having the same font size, even though the total plot area will differ. Is there a way to do this? If not, it would be extremely helpful.
Steve R.
Giving multiple graphs the same box size
-
Steve Railsback
- Posts: 1
- Joined: Fri Nov 30, 2018 10:43 am
-
DPlotAdmin

- Posts: 2312
- Joined: Tue Jun 24, 2003 9:34 pm
- Location: Vicksburg, Mississippi
- Contact:
"Specify plot size" dimensions ARE the size of the box around the plot in your example. The trouble is that each entire plot will be centered within the page margins, so the plots don't line up.
I don't have an easy fix for this, sorry. I'll have to think on it a bit.
I don't have an easy fix for this, sorry. I'll have to think on it a bit.
Visualize Your Data
support@dplot.com
support@dplot.com
-
DPlotAdmin
- Posts: 2312
- Joined: Tue Jun 24, 2003 9:34 pm
- Location: Vicksburg, Mississippi
- Contact:
By the way the font sizes should definitely be the same (assuming they're the same in both plots). If they aren't, it is because the "larger" plot - the one with 100,000 on the Y axis - won't fit within the specified margins and everything including font sizes is scaled down.
You might want to check your margins. This will not, however, fix the alignment problem. The only way I can see to do this at present is Copy/Paste into Word, manually align the plots, then save as PDF. Which I understand is a lot more effort than you're looking for.
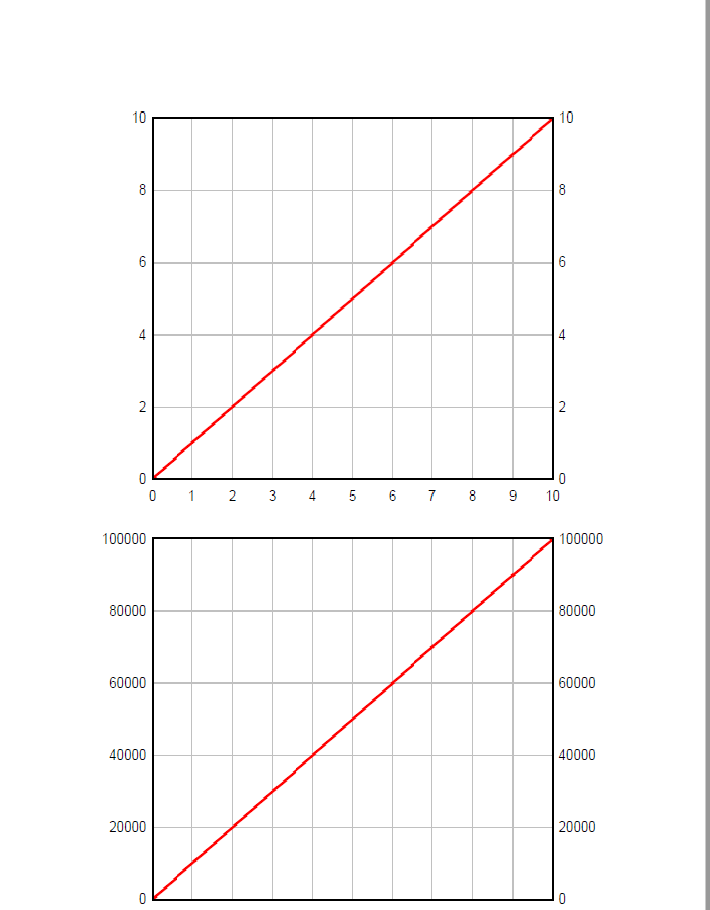
Another way (which may be even less satisfactory) is to use the Multiple Axes option on both plots and duplicate the left Y axis on the right, with C=0, D=1. Now the plots will line up:
You might want to check your margins. This will not, however, fix the alignment problem. The only way I can see to do this at present is Copy/Paste into Word, manually align the plots, then save as PDF. Which I understand is a lot more effort than you're looking for.
Another way (which may be even less satisfactory) is to use the Multiple Axes option on both plots and duplicate the left Y axis on the right, with C=0, D=1. Now the plots will line up:
Visualize Your Data
support@dplot.com
support@dplot.com