| View previous topic :: View next topic |
| Author |
Message |
arthur_etchells
Joined: 15 Jul 2005
Posts: 30
|
 Posted: Fri Jul 15, 2005 9:31 am Post subject: Setting scaling factors programatically Posted: Fri Jul 15, 2005 9:31 am Post subject: Setting scaling factors programatically |
 |
|
Just wanted to say this is an awesome program. I'm just having a hard time figuring out how to set scaling factors programatically. The xy numbers for a 3d contour plot have a 3:2 ratio (or 1.5:1). When I graph these numbers it gives the xy plane a square appearance. I would rather preserve the aspect ratio specified in the points.
I get exactly the result I want by doing the following...
-Leaving the "Always auto-adjust scale factors on 3D plots" option in the General options pane enabled
-Specifying the programatic contour plot options normally (ie without any scaling factor specifications).
-Manually changing the xy scaling ratio in contour options to from 1:1.5 to 1:1, while leaving the z scaling ratio unchanged
Basically I need to figure out how to do the last item programatically.
Thanks for any and all help,
Arthur
PS: Is there any way to tell DPlot to make a solid plane where the graph clips, instead of leaving the clipped areas transparent? |
|
| Back to top |
|
 |
arthur_etchells
Joined: 15 Jul 2005
Posts: 30
|
| Posted: Fri Jul 15, 2005 9:48 am Post subject: |
|
|
I've tried the following command:
[ContourScales(Xscale, Yscale, Zscale)]
But setting this to [ContourScales(1, 1, 1/2)]
Leaves the scale factors in contour options unchanged. Are there other commands that I'm missing? |
|
| Back to top |
|
|
DPlotAdmin
Site Admin

Joined: 24 Jun 2003
Posts: 2310
Location: Vicksburg, Mississippi
|
| Posted: Fri Jul 15, 2005 10:23 am Post subject: |
|
|
Arthur,
Thanks very much for your comments.
This:
| Quote: | [ContourScales(Xscale, Yscale, Zscale)]
But setting this to [ContourScales(1, 1, 1/2)] |
is what you want, but the 1/2 for Z won't be interpreted correctly. All of those entries must be simply numbers - no fractions, equations, dates, times, etc. Perhaps someday I'll add the ability to express all values in more general ways, but in the meantime, use
[ContourScales(1,1,0.5)]
_________________
Visualize Your Data
support@dplot.com |
|
| Back to top |
|
|
arthur_etchells
Joined: 15 Jul 2005
Posts: 30
|
| Posted: Fri Jul 15, 2005 11:20 am Post subject: |
|
|
Ah, so it was skipping the commands with the incorrect syntax. Gotcha.
Just a couple other questions
Is there any way to change DPlot's behaviour with clipped z values?
And, is there any way to allow dplot to scale the z values automatically (while manually specifying the x & y scaling factors?
Not really a big deal about the 1/2 vs 0.5, thanks a lot for of your help. |
|
| Back to top |
|
|
DPlotAdmin
Site Admin
Joined: 24 Jun 2003
Posts: 2310
Location: Vicksburg, Mississippi
|
| Posted: Fri Jul 15, 2005 11:28 am Post subject: |
|
|
| Quote: | | Is there any way to change DPlot's behaviour with clipped z values? |
Probably, but... what do you have in mind?
| Quote: | | And, is there any way to allow dplot to scale the z values automatically (while manually specifying the x & y scaling factors? |
Unfortunately no. I need to think on this one a bit... perhaps something like
[ManualScale(xlo,ylo,xhi,yhi,,)]
would force the X and Y extents and use the actual extents for Z. Likewise
[ManualScale(xlo,ylo,xhi,yhi,,100)]
would use 100 for the upper limit and the actual minimum for the lower limit.
_________________
Visualize Your Data
support@dplot.com |
|
| Back to top |
|
|
arthur_etchells
Joined: 15 Jul 2005
Posts: 30
|
| Posted: Fri Jul 15, 2005 6:11 pm Post subject: |
|
|
In regards to the z value clipping, I was thinking of something like displaying the clipped portion of the graph as a flat surface, perhaps as a different color. Not sure if this is possible, just a thought. Thanks very much for your help.
Arthur |
|
| Back to top |
|
|
Lolo15
Joined: 23 Sep 2015
Posts: 3
Location: France
|
| Posted: Mon Mar 29, 2021 11:04 am Post subject: |
|
|
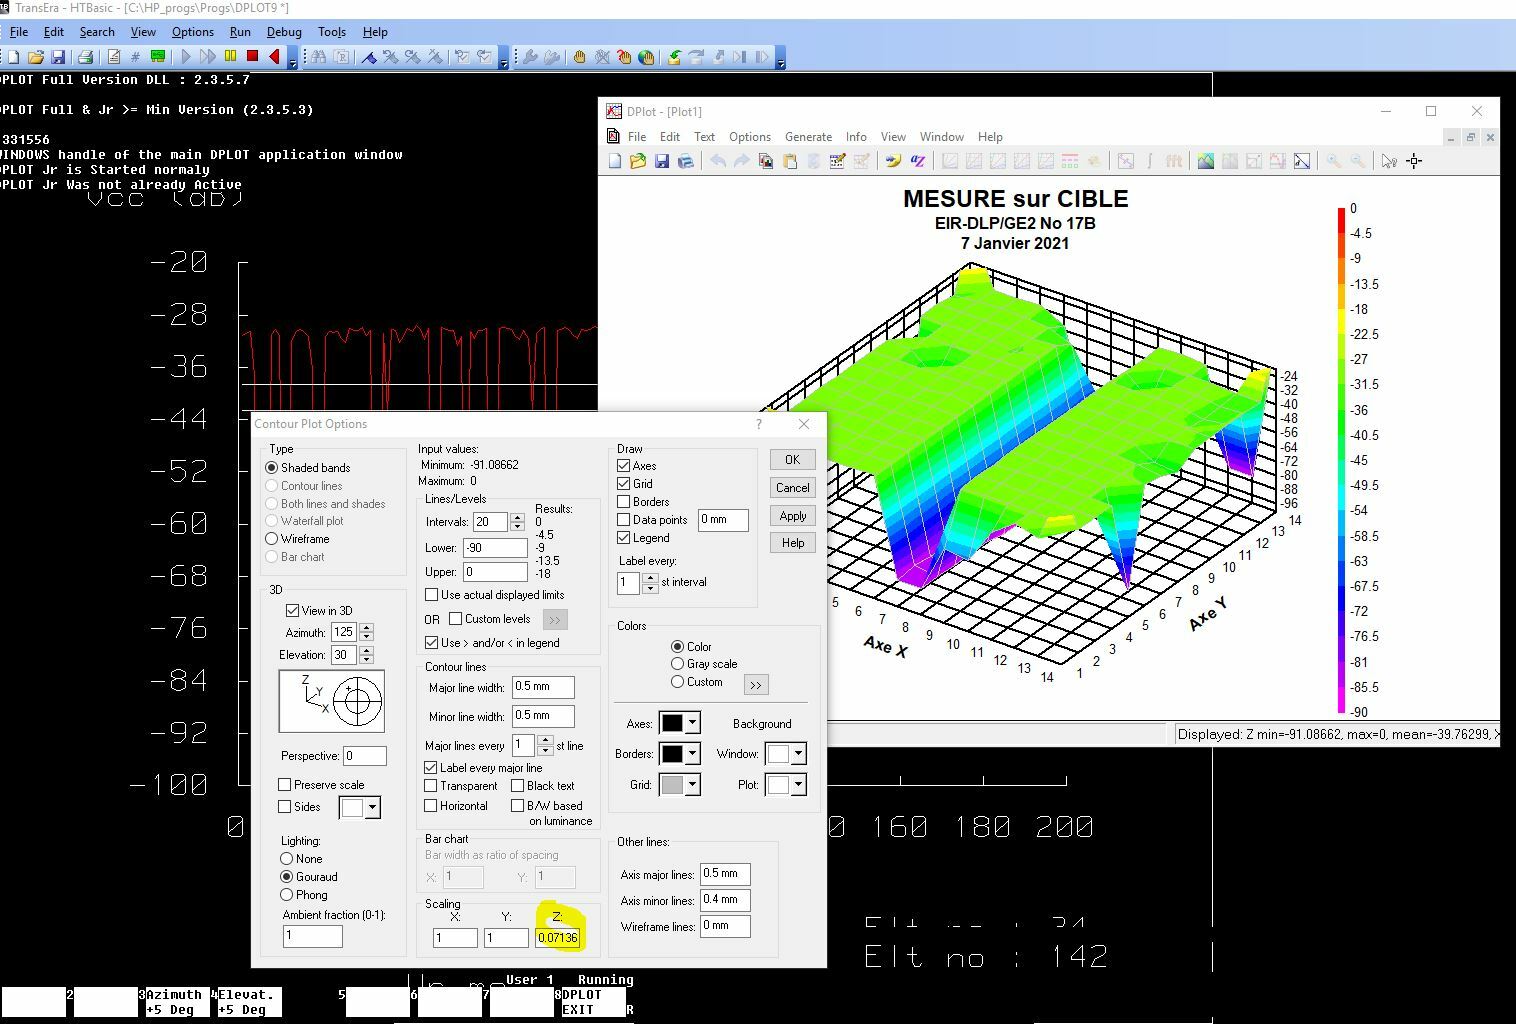
I have a question about the Z Scaling on a 3D curve :
How this Z scale value is calculated ?
 |
|
| Back to top |
|
|
DPlotAdmin
Site Admin
Joined: 24 Jun 2003
Posts: 2310
Location: Vicksburg, Mississippi
|
| Posted: Tue Mar 30, 2021 6:30 am Post subject: |
|
|
By default it sets the scale factors such that the physical distance along the X and Y axes is the same, and the distance along Z is approximately 1/2 of that. This generally fills the display nicely.
_________________
Visualize Your Data
support@dplot.com |
|
| Back to top |
|
|
|


