| View previous topic :: View next topic |
| Author |
Message |
raydela
Joined: 10 Sep 2003
Posts: 46
Location: Oxford, MI, USA
|
 Posted: Fri Aug 20, 2010 10:55 pm Post subject: 3D Parametric Equations, Cylindrical & Spherical Coordin Posted: Fri Aug 20, 2010 10:55 pm Post subject: 3D Parametric Equations, Cylindrical & Spherical Coordin |
 |
|
Do you have any plans to extend 3D capabilities to allow representing 3D parametric equations?
Also, like 2D polar coordinates, in conjunction with 3D it would be nice to be able to represent equations in cylindrical or spherical coordinates.
Check out the following website for capability I'd like to see in DPlot:
http://www.flashandmath.com/advanced/motion3d/motion3d.html
As a specific example, I wanted to find an equation for a form that I call (for lack of finding proper technical term for it) a 'helical toroid' coil winding. The following provides a decent example of what I wanted to achieve (except that the website above has limited plotting increments so it has somewhat grainy resolution):
x =(1+0.25*cos(75*t))*cos(t)
y = (1+0.25*cos(75*t))*sin(t)
z = 1+2.0*sin(75*t)
The reason I wanted such an equation was to take it to an FEA modeling program to see what kind of magnetic field such a coil would create (I still haven't got this far yet so don't ask me what the result was - If you know how to do this already please let me know!)
Ray Delaforce |
|
| Back to top |
|
 |
DPlotAdmin
Site Admin

Joined: 24 Jun 2003
Posts: 2311
Location: Vicksburg, Mississippi
|
| Posted: Mon Oct 11, 2010 12:18 pm Post subject: |
|
|
For anybody else following along here, Ray generated 25,000 points from a 3D parametric equation in Excel, then used the Add-In XYZScatter function to produce this plot:
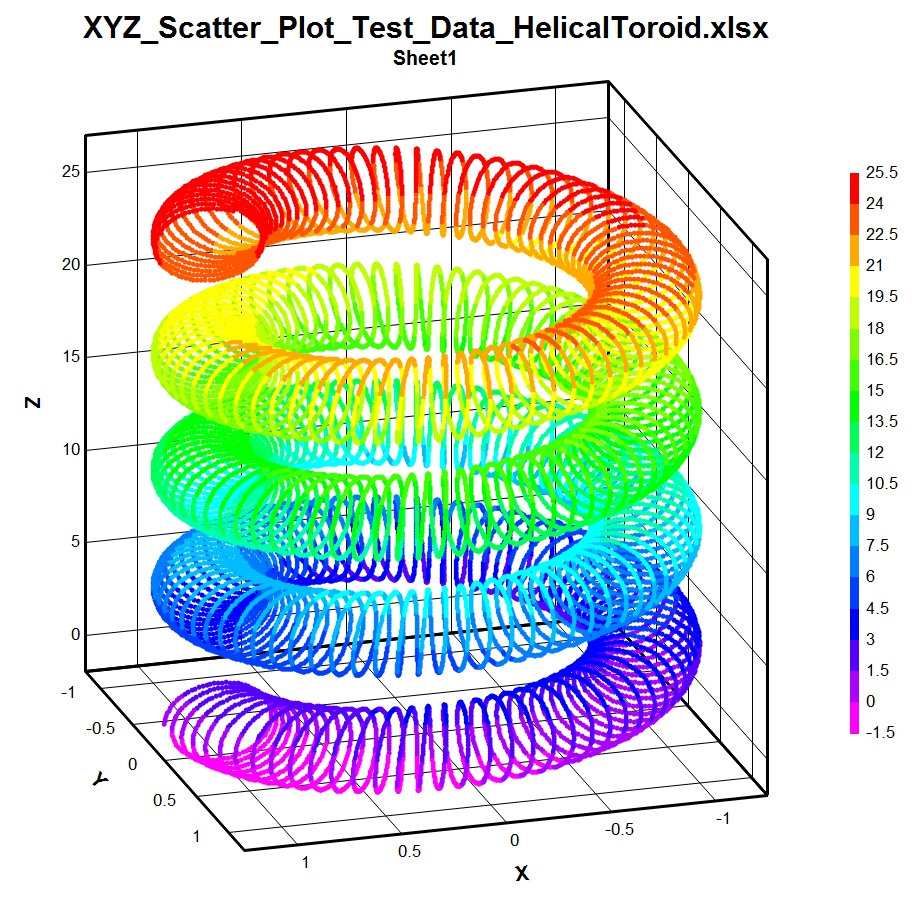
The equations used in this case were:
X =(1+0.25*cos(75*t))*cos(t)
Y = (1+0.25*cos(75*t))*sin(t)
Z = t+2.0*sin(75*t)
with t varying from 0 to 25 in increments of 0.001.
Thanks for sharing, Ray.
_________________
Visualize Your Data
support@dplot.com |
|
| Back to top |
|
|
raydela
Joined: 10 Sep 2003
Posts: 46
Location: Oxford, MI, USA
|
| Posted: Tue Oct 12, 2010 12:56 am Post subject: |
|
|
David, thanks for advice on how to do this!
Please note that my initial post shows incorrect equation for Z:
Z = 1+2.0*sin(75*t).
The equation accompanying David's reply with my example plot has the correct equation:
Z = t+2.0*sin(75*t)
Also, once the data is imported from Excel, there are a few major 'coarse' adjustments of the default values that are required to get the desired appearance. These adjustments are:
1.) Options | Extents/Intervals/Size -- I had to reduce the X & Y extents from defaults.
2.) Options | Symbol Styles... Symbol Size had to be specified (0.03 or something like this) to see the detail of the 'space curve' line (which I call a 'helical toroid' for lack of finding proper mathematical term despite extensive search on the Internet).
3.) Options | Scatter Plot Options... The Z Scale factor had to be changed from default of 1 to 0.1 to so that the aspect ratio of the 'hose' shape of the helix was approximately circular.
Great support for a great product!
Ray |
|
| Back to top |
|
|
joecar
Joined: 11 May 2006
Posts: 43
Location: So.Cal.
|
| Posted: Thu May 26, 2011 4:59 pm Post subject: |
|
|
| Where can I find the XYZscatter addin...? |
|
| Back to top |
|
|
DPlotAdmin
Site Admin
Joined: 24 Jun 2003
Posts: 2311
Location: Vicksburg, Mississippi
|
| Posted: Thu May 26, 2011 5:12 pm Post subject: |
|
|
If you installed the DPlot AddIn for Excel, it is on the DPlot AddIn menu.
_________________
Visualize Your Data
support@dplot.com |
|
| Back to top |
|
|
|

