|
Symbol Styles command (3D and 4D scatter plots) |

  
|
| Show/Hide Hidden Items |
|
Symbol Styles command (3D and 4D scatter plots) |
|
| Show/Hide Hidden Items |
Symbol types
Select a symbol from the list, or click the "Other..." button to use a character from the Wingdings, Wingdings 2, or Wingdings 3 fonts. Note: These fonts must be installed on your system for this feature to work properly.
Note that there are two sets of inverted triangle symbols. The first two are placed such that the geometric center of the triangle is at the corresponding data point. The second two are placed such that they align vertically with the non-inverted (apex at the top) triangle symbols.
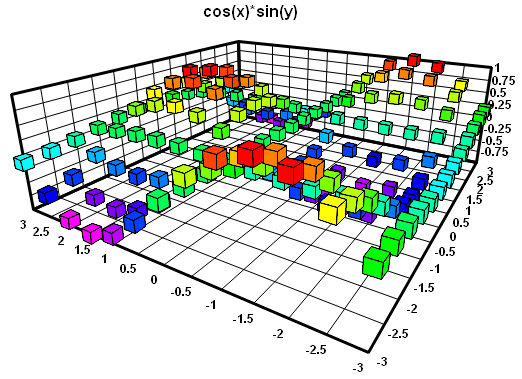
A cube symbol is available when the "Symbol size in Z units" box is checked. In that case, this symbol (unlike all others) will be drawn using the perspective settings for the plot. The perspective value may be set with the Scatter Plot Options menu command.
|
Symbol size
If the symbol size is set to 0.0 inches, DPlot uses a default symbol height of 1/40 of the height of the output device.
Symbol sizes in Z units
If checked, the symbol size uses the same scaling as the Z values on the plot. If you zoom in/out or change the extents of the plot, the symbols will be resized accordingly. This option applies to all symbols on the plot; you cannot have symbols for one curve be a fixed physical size and symbols on another curve proportional to the plot amplitudes. Symbols in the legend will be drawn a fixed size, roughly the same height as the accompanying text (if this option is unchecked then legend symbols will be the same size as those used in the plot).
Symbol frequency
Enter the frequency at which symbols are drawn. For example, if set to 1 then symbols will be drawn at every data point; if 2 then symbols are drawn at every other point. This option might be useful for plots with a large number of data points.
Outline solid symbols
If checked, solid filled symbols (not including Wingdings characters) will be outlined in the color selected below this checkbox. If unchecked, symbols are drawn with the color associated with that curve. The checkbox setting is applied to all curves; the color selection is specific to each curve.
Shortcut:
| Click |
|
Related macro commands |
Page url:
https://www.dplot.com/help/index.htm?symbol_styles_command_3d_scatt.htm