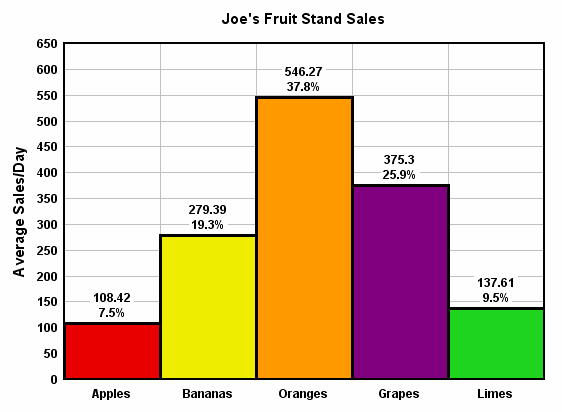
This command allows you to specify up to 100 text labels that can replace or be used in combination with the numbers, dates, and/or times that appear on the X or Y axes or the Z axis of a 3D or 4D plot. No effort is made to prevent these labels from overlapping those numbers, dates, or times. The labels will be drawn with the same orientation as the numbers along the axis. Orientation is controlled with the Number Formats command on the Options menu. To use these labels only, set the number format for the corresponding axis to "None" using the Number Formats command. Alternatively, right-click on any of those numbers and select "None".
Similar functionality can be achieved with notes, but exact placement of notes is a bit cumbersome: If note placement is made a function of plot space (the default), if you zoom or otherwise change the extents of the plot the note positions will change. And if note placement is made a function of data space, the note will not be drawn if the anchor point is outside the limits of the plot.
| X/Y|/Z| value: | The location of the label along the axis chosen with Location (see below). |
| Label: | The text you want to draw. |
| Location: | The axis associated with the label. For 3D views of 3D or 4D data, the labels will always be drawn on the same side of the plot that the numbers along the coordinate axes would normally be drawn. |
| Offset: | The distance from the alignment point of the normal axis labels to the alignment point of the label you're creating. In most cases 0 is the appropriate value. But if you want, for example, to call attention to a particular label you might want to give a small positive offset. Offsets are positive away from the plot: A positive offset for "Y left" shifts the label to the left, for "Y right" to the right. |
Example:

For a step-by-step explanation of how this graph was created, see the topic How do I replace the X (or Y) axis labels with custom text?
Character formatting
Labels may include formatting codes for subscripts, superscripts, etc., as described below. For overbar, dot accents, or Wingdings fonts see Format Codes below.
|
To use subscripts, select the text (highlight using the cursor) you want to format as subscript, then click this button. Shortcut: CTRL+↓ |
|
To use superscripts, select the text (highlight using the cursor) you want to format as superscript, then click this button. Shortcut: CTRL+↑ |
|
To insert special characters (Greek letters, trademark symbols) found in the Symbol font, click on the insertion point, then click this button. Shortcut: CTRL+S NOTE: On versions of Windows older than Vista, the Symbol font with normal weight may only be available in a horizontal orientation. Bold weight can generally be rotated to any angle. This limitation is of course important for the Y axis label on all plot types, and all axis labels in 3D views. |
|
To make a portion of the text bold, select the text (highlight using the cursor) you want to format as bold, then click this button. Shortcut: CTRL+B |
|
To make a portion of the text italic, select the text (highlight using the cursor) you want to format as italic, then click this button. Shortcut: CTRL+I |
|
To make a portion of the text underlined, select the text (highlight using the cursor) you want to format as underlined, then click this button. Shortcut: CTRL+U |
|
To double the size of one or more characters, select the applicable characters (highlight using the cursor), then click this button. Shortcut: CTRL+2 |
|
To use a custom color on a portion of the text, select the text (highlight using the cursor) you want to draw using a different color, then click this button. Shortcut: CTRL+K |
Format codes
The formatting buttons simply insert special characters into the text that have specific meaning to DPlot. Use of these buttons is not strictly necessary - you can of course physically type these codes with the same result. Format codes may be nested, so you can have (for example), subscripted Greek characters or subscripts of subscripts. Note that the bold, italic, and underline codes will have no effect if the font already possesses that attribute. In other words, using {\b} on a bold font will not make the font "bolder".
Format |
Code |
Example |
Result |
Bold |
{\btext} |
{\bBold} text |
Bold text |
Italic |
{\itext} |
{\iItalic} text |
Italic text |
Subscript |
{\dtext} |
P{\dso} |
|
Superscript |
{\utext} |
X{\u2} + Y{\u2} |
|
Symbol |
{\stext} |
e{\u(-{\sa}t)} |
|
Underline |
{\_text} |
{\_underlined} text |
underlined text |
Enlarged |
{\2text} |
{\2{\sS}}x |
|
Color |
{\cBBGGRRtext} |
{\c0000FFRed} Text |
Red Text |
Overbar |
{\otext} |
{\oY}=56.23 |
|
Dot accent |
{\.text} |
Flow = {\.V} |
|
Double dot accent |
{\:text} |
y = y{\d0} + {\.y}t - {\:y}t{\u2}/2 |
|
{\w1text} |
{\w1N} Danger {\w1N} |
|
|
Wingdings 2 |
{\w2text} |
{\w2R} Passed |
|
Wingdings 3 |
{\w3text} |
Arrows {\w3!"#$} and\nmore arrows {\w3NOPQ} |
|
|
Related macro commands |
Page url:
https://www.dplot.com/help/index.htm?helpid_xlabel.htm