|

  
|
||
|
|
||
A vector plot allows you to chart four variables in two dimensions by varying the lengths and angles of vectors drawn from each data point in a scatter plot based on a third and fourth variable. In DPlot, the third and fourth dimensions (angle and magnitude) are taken from the Y values of two other curves. The source curves for the vector angles and magnitudes will not be drawn. DPlot ignores the X values for the source curve(s); e.g. the n’th point of the angle source curve is used as the angle for n’th point of the selected curve, regardless of whether the X values match up. This command is disabled if fewer than 3 curves are present in the plot.
The low and high vector lengths and colors are mapped to the low and high absolute value of the amplitudes from the magnitude source curve, respectively. If you want all vectors to be the same size, enter identical values for the low and high sizes. Likewise if you want all vectors to be the same color, select identical colors.
Line segments are not drawn between data points for vector plots, though you can mix curves using vectors with curves that do not use this feature.
Example
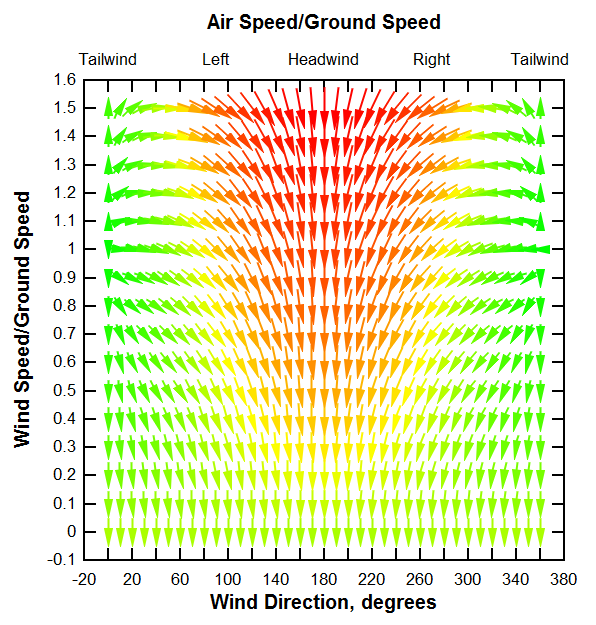
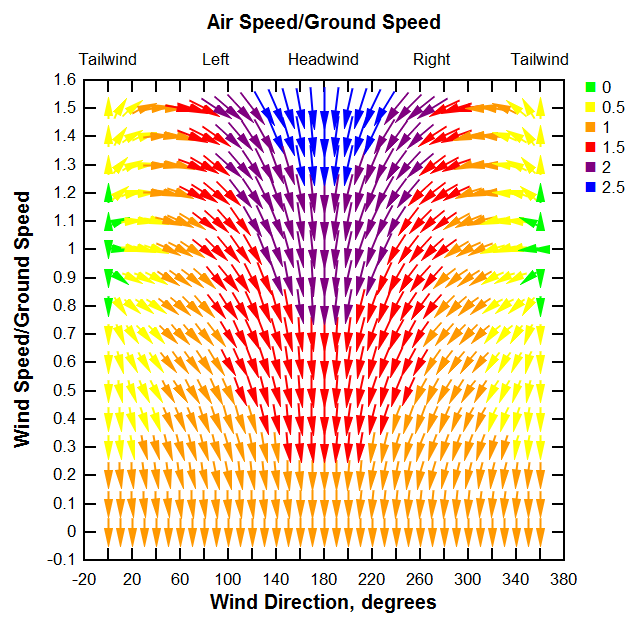
Discrete colors (default = blend)
By default colors are blended between the low and high values (or between each color range if more than 2 colors are specified).
Show color key
If checked, DPlot generates a legend with optional heading. This color key may be moved around on the graph by clicking and dragging with your mouse. Attributes (framed, opaque, etc.) may be changed by right-clicking on the key or by double-clicking. The color key text is fixed and cannot be changed.
Specify magnitudes for colors
If unchecked, each color range is divided evenly between the low and high magnitude values. If checked, you may enter specific values for each color.
Color key heading
Enter a heading for the color key. This entry is meaningless if Show color key is unchecked. For multiple lines, use \n sequences. (For C programmers, that is the actual characters \n, not a line feed). For example the text "First line\nSecond line" will be split into two lines as you'd expect.
Example (Discrete (6) colors and Show color key checked)
|
Related macro commands |
Page url:
https://www.dplot.com/help/index.htm?helpid_vectors.htm