|
Right-Click and Mouse Wheel Operations |

  
|
|
Right-Click and Mouse Wheel Operations |
|
Many simple operations within DPlot can be performed with a right-click of the mouse or a turn or click of the mouse wheel. This topic illustrates all of the areas of a plot in which various right-click and mouse wheel operations may be performed.
RIght-Click
For many of the options discussed in this topic, we’ll take a look at the example DPlot file EX10.GRF.
Scaling

Right-click anywhere within an unoccupied area of the boundaries of a graph to display axis scaling options.
Symbol and Line Styles, Color, Copying data, Hiding a curve, Adding a Label

Right-click on a curve to change the line style, symbol style, line width, symbol size or color used to draw the curve, copy tab-separated columns of data to the Clipboard, or hide a curve. (Tip: you can also hide a curve w/o the right-click menu by pointing to a curve and clicking the middle mouse button, or hide all curves other than the one clicked by pressing CTRL + the middle mouse button. Clicking the middle mouse button while the mouse does not point to a curve will make all curves visible.)
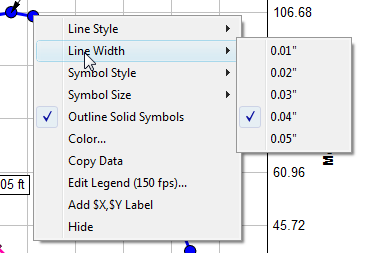
Units for the line width and symbol size menues are determined by the Default dimensions setting on the General Options dialog.
If you hide a curve using the right-click menu, you can later make it visible with the Hide Curves or Unhide All Curves commands on the View menu.

Select "Add $X, $Y Label" to add a text label tied to a specific data point. The $X will be replaced with the corresponding X value; $Y will be replaced with the corresponding $Y value. Both X and Y will be rendered using the number format for the respective axis. The label will initially have a frame and be opaque, middle-right justified at the point or middle-left justified for points near the right edge of the document window. If a point is already labeled, this option is not shown.

You can drag the label with your mouse to a new location and change any of the label's attributes with the right-click menu (see below) or double-click on the label to bring up the Point Labels dialog box.
Title lines and axis labels

Right-click on any title line or the axis labels to edit the text or to change the font of that character string.

Right-click anywhere within the legend to change its attributes, hide it, or change how the legend box is aligned with its specified location. If the legend is hidden then this right-click menu is of course no longer accessible. In that case you can edit legend attributes with the Legend/Labels command on the Text menu.
Legend entries

Right-click on specific legend entries to hide the corresponding curve, hide all curves except for the corresponding curve, and/or to change the precedence of a curve. Curves hidden with the right-click menu can later be made visible with the Hide Curves or Unhide All Curves commands on the View menu.

Right-click on a note to edit the text, hide the note, change its attributes, or change how the note is aligned with its specified location. (If a note is hidden then the right-click menu is of course no longer accessible and note attributes can only be changed with the Add/Edit Note command on the Text menu.)
Point labels

Right-click on a point label to edit the text, delete the label, or change its attributes. "Copy" copies the text of the label to the Clipboard, replacing text shortcuts (e.g. $X, $Y) with their numeric substitutions.
Number formats, extents, tick marks

Right-click on any of the numbers along an axis to change the format used for those numbers, set the extents of that axis, or change the tick mark interval.
Axis style

Right-click on the coordinate axes or the box around the plot to change the style of the axes.
Edit menu
Right-click outside the extents of a graph to display the Edit menu.
File caption

You can quickly toggle the Print Caption feature of the Text menu on/off by right-clicking in the lower right corner of a plot.
3D Options

For all 3D data you can display most of the Options menu options by right-clicking anywhere on the plot. While displaying 3D views this menu will include options for various applicable plot types (Waterfall Plot and Bar Chart are not shown for random 3D points; those options are only valid for Z values on a rectangular grid. To produce a table of Z values from random 3D points see the Generate Mesh command on the Options menu.) The latter options are particularly useful for spinning a plot around using the Ctrl+arrow keys shortcuts: Surface plots generally take much longer to draw than any other plot type because DPlot calculates the color of every individual pixel. So you might want to switch to a wireframe plot before using those shortcuts, then switch back to a surface plot using this same right-click option once you have the view angles you want.
Contour labels

For 2D views of surface plots with contour lines, you can right-click on any of the contour labels to change the font, color, transparency, and frequency of those labels. Each of these options is of course also available on the Contour Options dialog.
Mouse Wheel
Zoom
You can zoom in by a factor of 2 by rotating the mouse wheel forward, and undo previous zooms by rotating the mouse wheel backward. When zooming in, new extents are based on the current mouse position (the new center of the graph will be roughly located at the mouse coordinates). If the mouse is not within the plot, the new extents are based on the center of the plot.
You can restrict zooming to the X direction by simultaneously pressing the CTRL key, or to the Y direction by pressing the SHIFT key. If you find that you often unintentionally zoom in or out by accidentally rotating your mouse wheel, you can disable this feature with the Disable zooming with mouse wheel checkbox under the General Options menu command.
Hide/Unhide Curves
For XY plots, you can:
| • | hide a curve by clicking the middle mouse button while the mouse points to a curve. |
| • | hide all curves except the one pointed to by pressing CTRL + the middle mouse button. |
| • | make all curves visible by clicking the middle mouse button while the mouse does not point to a curve. |
If you find that you often unintentionally hide/unhide curves by accidentally pressing the middle mouse button, you can disable this feature with the Disable hide/unhide with middle mouse button checkbox under the General Options menu command.
Page url:
https://www.dplot.com/help/index.htm?helpid_rightclick.htm