|

  
|
||
| Show/Hide Hidden Items |
|
|
||
| Show/Hide Hidden Items |
Displays a dialog box that allows you to specify the appearance of the coordinate axes.
X2 = A+B*X1
A second X axis is linked to the primary X axis by the function X2 = A + B*X1. This option might be useful for displaying output in two different units, for example. You can enter equations from either coefficient.
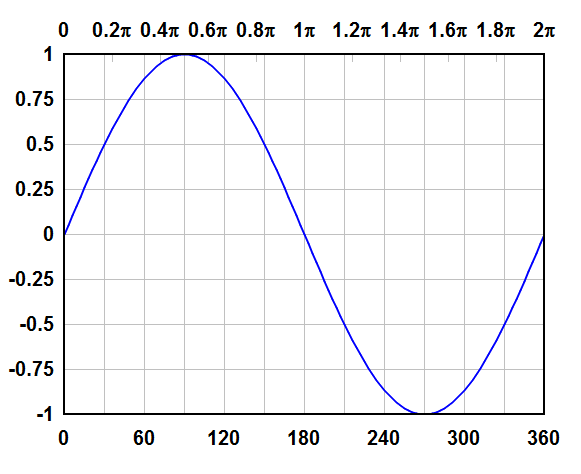
These settings:
...along with "Pi Multiples" for the number format on the second X axis results in:
|
Y2 = C+D*Y1
A second Y axis is linked to the primary Y axis by the function Y2 = C + D*Y1. This option might be useful for displaying output in two different units, for example. Note that the function relating Y2 to Y1 is a relationship between the numbers, not the units, displayed alongside the axes. For example, if the primary Y axis has units of inches, and the second Y axis has units of centimeters, then C=0, D=2.54 (not 1 cm = 0. + 0.3937 inches). As with X, equations may be used for C and D.
Independent Y2
A second Y axis is independent of the primary Y axis. In this case, you specify which curves are associated with which axis. The first curve in the plot must always be associated with the primary Y axis. This option might be useful for plotting, for example, pressure-time histories, with pressure associated with the primary Y axis and impulse associated with the second Y axis. Since the first curve must always be associated with the primary Y axis, this option is disabled if the plot has only one curve. For an example of this setting in action see EX04.GRF - Multiple independent Y scales.
For grid lines, use independent tick marks on dependent scales
If checked and grid lines are used, DPlot will draw labels on the dependent scales at "nice" intervals, identical to those drawn if Box Around Curves is used instead of Grid Lines. With X2=0.3048*X1, Y2=2.54*Y1:

If unchecked, labels will be drawn at the grid line interval, with no additional tick marks:

This setting is applicable to linear and logarithmic scales.
|
Related macro commands |
Page url:
https://www.dplot.com/help/index.htm?helpid_multipleaxes.htm