|

  
|
||
|
|
||
Shortcut:
![]() Click
Click ![]() on the toolbar.
on the toolbar.
Displays a dialog box listing minimum and maximum amplitudes and the point at which they occur, along with other statistical parameters. Use the List Peaks within a Range menu command if you want these same parameters for a subset of the data.
If N is the number of points and y is the amplitude of each point, then the mean is given by

Standard deviation is given by

Standard error is given by

Standard error is only applicable to XY plots.
Skewness is a measure of the lack of symmetry in a distribution. Skewness is given by

For N=1, skewness is reported as 0.
Kurtosis is a measure of whether a distribution has a high peak or is flat relative to a normal distribution. Kurtosis as calculated by DPlot is given by
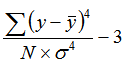
For N=1, kurtosis is reported as 0.
This is also known as excess kurtosis. Three is subtracted from the formula as an adjustment to make the kurtosis of a normally distributed variable equal to 0.
Page url:
https://www.dplot.com/help/index.htm?helpid_listpeaks.htm