|
Getting Started with XYZ Scatter Plots - Data From a Disk File |

  
|
|
Getting Started with XYZ Scatter Plots - Data From a Disk File |
|
Select the Open command on the File menu. The only built-in file format for 3D scatter plots is file type K on the Select File Type dialog:

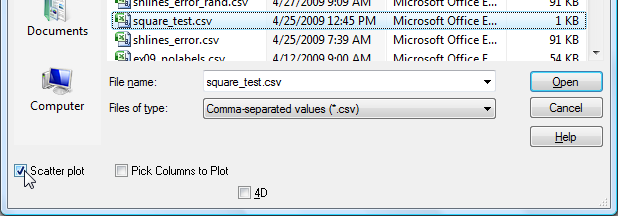
Click OK. On the subsequent Open dialog box, be sure to check the Scatter plot box, else your data will be interpreted as a surface plot.
This format is an ASCII text file containing randomly-spaced 3D points, one X,Y,Z triplet per line. Comma-separated values (CSV) files produced by Microsoft Excel may be imported using this file type. Columns may be separated by commas, spaces, or tabs.
Unlike 3D surface plots, all points are preserved in 3D scatter plots, including those with indentical X,Y values. Also, 3D scatter plots can contain multiple data sets. Data sets are separated by a single blank line. 3D scatter plots saved by DPlot as CSV files will use this same format.
This file format may optionally contain 3 title lines and X, Y, and Z axis labels preceding the data. If included, these lines should start and end with double-quotation marks. DPlot reads labels in the order 1st title line, 2nd title line, 3rd title line, X axis label, Y axis label, Z axis label. So if you want, for example, to include all axis labels but have only one title line, the 2nd and 3rd lines in the file should be pairs of double-quotation marks. Alternatively, if the X, Y, and Z axis labels are on the same line (such that there are 3 pairs of double quotation marks on this line), DPlot will interpret this line correctly regardless of whether any title lines precede it.
Page url:
https://www.dplot.com/help/index.htm?helpid_gs_xyzscatter_file.htm