|

  
|
||
|
|
||
Prompt to save changed plots
Normally DPlot will prompt you before exiting to ask whether you want to save the current plot if it has been edited in any way. Uncheck this box if you find this feature to be annoying.
Allow undo
Check this box to allow you to undo the last 100 operations (using the Edit>Undo command) or redo previous undo operations. If you frequently work with large data sets, this feature may cause DPlot to be a bit more sluggish than you'd like, as the entire data set will be saved to disk every time you edit the data values in any way.
If this box is checked, DPlot will always start maximized (the window will fill the display). If unchecked, DPlot will start with the same position and size that were in effect the last time you closed the program.
Always auto-adjust scale factors on 3D plots
If this box is checked, DPlot will always initialize the X, Y, and Z scale factors (normally set on the Contour Plot Options dialog) such that the plot is square in the XY plane and the Z extents appear to be about 1/2 that of X and Y. This is a useful feature if you frequently plot data sets with values in different units.
Always force symbols on/lines off for triangle plots
Triangle plots are normally drawn with symbols at each data point, rather than line segments between points. If this box is checked then DPlot will automatically select a symbol style for all data sets (if one is not already selected) and set the line style for each data set to "None".
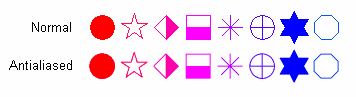
Antialias objects on display output
If this box is checked, symbols and line segments drawn on the display monitor will be antialiased, generally improving the appearance. This option is disabled if the display color depth setting is 256 colors (8 bits per pixel) or fewer.
This option will cause DPlot to take longer than normal to render a plot, particularly with 3D scatter plots and XY plots with many thousands of points or a thousand or more symbols. You may prefer to leave this option unchecked while editing a plot, and turn the option on before saving the plot to a bitmap. Alternatively, if you sometimes work with large data sets in XY plots but for all other graphs would like to keep antialiasing turned on, enter the maximum number of points for which you want to keep antialiasing in the For XY plots,... box. The default value of 5000 points generally works well.
Initially turn symbols off/lines on
If this box is checked, then for new XY plots DPlot will initially force the symbol type for all curves to none and the line type (if the line type is set to none) to solid lines. If this box is unchecked, settings for line and symbol styles are transferred from the first open document window or from DPlot's settings file for the first document window opened. (Line styles and symbol style settings for that first open document are retained even if the document currently has no plot.) This setting has no effect on the "Always force symbols on/lines off for triangle plots" setting.
This feature will prevent frustration for users who typically plot very large (several hundred thousand point) XY plots but also on occasion create plots with symbols, since symbols (especially anti-aliased symbols) take considerably longer to draw than line segments.
Recalculate extents of XY plots after hiding/unhiding curve(s)
If this box is checked, then the plot extents will be recalculated after hiding or making visible one or more curves using the Hide all curves but... or Unhide all curves commands on the View menu or one of the Hide commands on the legend right-click menu, ignoring any invisible curves. If this box is unchecked, then the extents are unchanged; invisible curves will be accounted for if/when the extents are recalculated.
This option is ignored if no curves are visible.
Adjust extents after applying transform to data values
If this box is checked, then when the Operate on X or Operate on Y menu commands are used: 1) if the transformation is only a function of the respective axis, e.g. with Operate on X and X=X*50+6 but not with X=X+Y, and 2) the transformation is applied to all curves on the plot, then manually-set extents and tick mark intervals on that axis are transformed as well. This option helps prevent producing unexpected and/or undesirable results, e.g. without this option multiplying all Y values by 10,000 with manually set tick marks produces 10,000 times as many tick marks. If the above two conditions are not both true or if an error occurs when applying the transform, then manual extents and tick marks are turned off. If this box is unchecked then the extents and tick mark interval settings are left alone. In the case of 3D plots, if this box is checked then manual extents and tick marks are turned off, regardless of the transform equation.
Show coordinates in popup when mouse hovers over data point
If checked, the X, Y, (and Z for 3D data) values of the point under the cursor are shown in a popup window. This feature works only in 2D views of your graph. If you find this feature annoying, uncheck this box.
X values consisting of times are always sequential
When reading a column of time values (e.g. 7:30:00 AM) from a text file or the clipboard, the times are translated internally to numbers. Midnight=0, noon=12, etc. If this box is checked then time values are adjusted, if necessary, such that the time in row N is greater than or equal to the time in row N-1. If this box is unchecked, the X axis value will wrap when the time passes through midnight. If your data consists of sequential times you should check this box. If your data consists of measurements taken at random times, not recorded chronologically, you should uncheck this box.
Automatically read preference file based on filename
If checked, then when opening a data file for a new document DPlot will check for the existence of a preferences file (previously saved with Save Preferences) with the same filename and extension of ".set", first in the folder where the data file resides, then in the default preferences folder (%APPDATA%\DPlot\Preferences). If found, that preferences file will be processed. This might be a handy option if you have data files which frequently change, but you don't want to go through the same formatting steps each time you open that file. This option is not applicable to DPlot files, which by definition contain all of the formatting options that would normally be saved to a preferences file. When opening multiple files, this option is only applicable to the first file selected.
Assume input dates are of the form d/m/y
When reading dates from text boxes, the clipboard, or a text file, DPlot looks for 3 separate fields (day, month, and year) and makes these assumptions:
If a field is non-numeric (i.e. Jan, January, Feb, etc.) then this field represents the month.
The year is assumed to be in the third field unless either of the first two fields is greater than 1000.
If this box is unchecked then assume the date is in the order m/d/y unless the first field is greater than 12.
If this box is checked then assume the date is in the order d/m/y unless the second field is greater than 12.
Disable zooming with mouse wheel
If unchecked, you can zoom in/out on a 2D view of a plot with your mouse wheel. Some users may find this feature annoying, unintentionally zooming in on a plot. If this box is checked then this feature is disabled.
If checked, you can zoom in on a 2D plot by clicking and dragging your mouse. You can restrict zooming to the X direction by first pressing the CTRL key, or to the Y direction by first pressing the SHIFT key.
If unchecked, clicking and dragging pans the plot. Whether this option is checked or not, you can pan a 2D plot with the keyboard arrow keys.
Disable hide/unhide with middle mouse button
If unchecked, you can:
| • | hide a curve by clicking the middle mouse button while the mouse points to a curve. |
| • | hide all curves except the one pointed to by pressing CTRL + the middle mouse button. |
| • | make all curves visible by clicking the middle mouse button while the mouse does not point to a curve. |
Check this option if you find that you frequently click the middle mouse button accidentally.
Default dimensions
This selection determines the default units used for entering line widths, symbol sizes, plot size, etc. You can override the default by supplying the appropriate unit suffix to numbers: " or in=inches, pt=points, mm=millimeters, cm=centimeters. Note that this entry has no effect on how these sizes are stored internally or saved to DPlot files, only on how these values are presented.
Open/Save default view
These options are available on Windows XP systems only. These settings determine the initial view type (thumbnails, icons, details, etc.) and sort order for the Windows common Open and Save dialogs shown by DPlot. For XP and later Windows versions, if you select a different view then that selection becomes the new default. However, the sort order will always revert to the selection shown on this dialog initially (because there is no good way to monitor and/or get that setting) for XP. The Sort in descending order setting is only meaningful when the view is set to Details. All other views will use ascending order. These options are not shown for Windows Vista and later versions because the OS (unlike XP) preserves the selected settings anyway, which makes these options somewhat redundant.
Max. number of header lines in multi-column text files
When first installed, DPlot will skip past up to 30 header lines in text files containing columns of data (file types D and K on the Select File Type dialog). Increase this value if your files contain more than 30 lines of text before the start of the data. This value should not be adjusted unless necessary: when you drag-and-drop files onto DPlot or open files in Explorer with Open With, DPlot must determine the file format. A larger value in this box than necessary means that DPlot will needlessly read that many lines from these files before determining that they are not multi-column text files.
When first started, DPlot will use the decimal symbol set with the Windows Control Panel. You can change that symbol here, independent of the Control Panel setting. If a comma is used, then multiple arguments to functions in Y=f(X) and similar commands as well as text placeholders must be separated by semicolons. This setting has no effect on macros or on calls to DPLOTLIB functions from another program: The decimal symbol in that context must be a period '.', and arguments must be separated by commas, with the exception of text placeholders which are passed to DPlot as is. Text file output and saving data to the Clipboard is also not affected by this setting: DPlot will use a '.' for the decimal symbol and CSV files will use a comma as the column delimiter.
When first started, DPlot will use the date separator from Control Panel, which is generally tied to a user's location and may be changed with regedit. You can change that symbol here, independent of the Control Panel setting. This setting might be important for German users (default date separator = '.') who work primarily with text files using a dot as the decimal separator (but no dates, or at least no dates using a '.' separator).
|
Related macro commands |
Page url:
https://www.dplot.com/help/index.htm?helpid_genoptions.htm