DPlotAdmin
Site Admin

Joined: 24 Jun 2003
Posts: 2310
Location: Vicksburg, Mississippi
|
 Posted: Thu Jul 24, 2008 2:34 am Post subject: Beta feature: OverlayDocument macro command Posted: Thu Jul 24, 2008 2:34 am Post subject: Beta feature: OverlayDocument macro command |
 |
|
As mentioned on the Revisions page, version 2.2 of DPlot has the ability to overlay one plot with another. But because there are still many gotchas to work out, and there are no doubt many gotchas that I can't imagine due to what you're going to try to do with this  , this feature is currently only available as a macro command and is undocumented, other that what you see here. , this feature is currently only available as a macro command and is undocumented, other that what you see here.
The macro command syntax is:
OverlayDocument(docnum|,alpha|,maskcolor||)
This will overlay the currently active document with the plot with document index "docnum" (the Window menu 1-based order of open documents).
The other two parameters deal with transparency, which was a bit disappointing in my trials. You can certainly come up with some colorful graphs using this feature, but I'm not sure that it is worth much from a technical standpoint.
alpha is the transparency level of the overlay, from 0 (completely transparent: invisible, in other words) to 255 (opaque). The background of the overlay plot is not drawn, so this setting has no effect there. You can come up with some interesting 2D views of 3D graphs with various alpha settings; beyond that I'm not sure what this might be good for. If you come up with a good example that uses 0<alpha<255 please let me know.
"maskcolor", if set, is the color that will be ignored in the overlay. This setting has no effect if alpha=0 or alpha=255. For example if the overlay plot has an opaque, white background legend and you use alpha=254, maskcolor=0x00FFFFFF then that background will not be drawn. Unfortunately maskcolor can only specify a single, exact color. So if you use antialiased lines or symbols this feature may not work especially well.
The overlaid plot will use its current extents and size with no consideration for the overlay extents. The scaling (linear, logarithmic, Mercator, etc.) of the overlay plot will be switched to that of the overlaid plot, and the extents, tick mark intervals, and size will be forced to the same values. (In other words if the real extents of the overlay are completely outside the extents of the overlaid plot, this command does nothing other than take up time.)
This feature was not intended for use with 3D views of plots and will be disabled for 3D views in the next release. The only reason I mention this is: yes, I know you can produce nonsense overlays with 3D plots in this version.
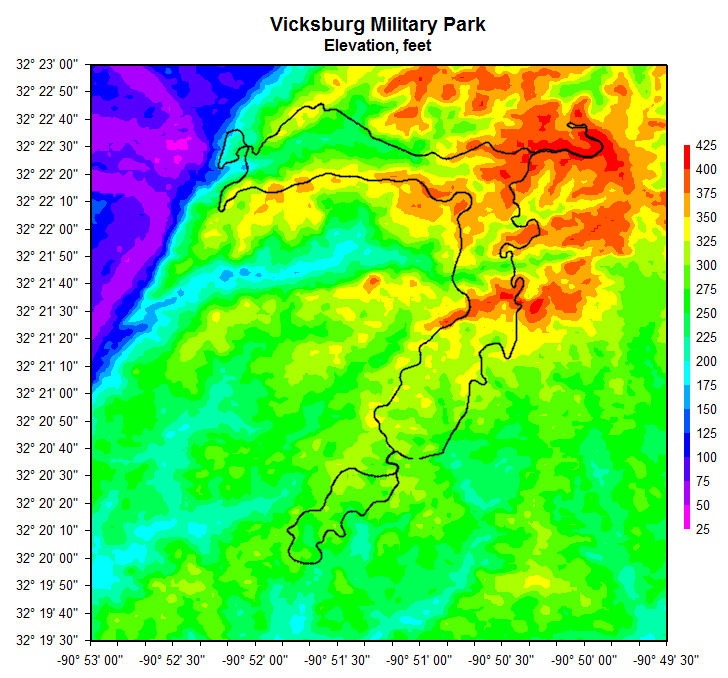
I'll come up with more examples when I catch my breath. For now, as shown before, here's a contour plot of the Vicksburg MS area (from NASA SRTM data) overlaid with a Garmin GPS device-produced lat-lon XY plot of the Vicksburg Military Park route:
Comments and suggestions are of course welcome.
_________________
Visualize Your Data
support@dplot.com |
|

