| View previous topic :: View next topic |
| Author |
Message |
AlPhuket
Joined: 04 Dec 2009
Posts: 5
|
 Posted: Fri Dec 04, 2009 2:00 am Post subject: Fill area under series depending on "Y" value Posted: Fri Dec 04, 2009 2:00 am Post subject: Fill area under series depending on "Y" value |
 |
|
| I am working on plots of tidal currents and would like to be able to Fill the area under a graph of the current values depending on a chosen value (ie: when the current is flowing less than 0.4 meters per second). Given the power of the functions I see, there must be a way I am overlooking to accomplish this, and any help will be appreciated. |
|
| Back to top |
|
 |
DPlotAdmin
Site Admin

Joined: 24 Jun 2003
Posts: 2310
Location: Vicksburg, Mississippi
|
| Posted: Fri Dec 04, 2009 11:56 am Post subject: |
|
|
Like this?
If so, use Options>Fill Between Curves. In the "1st Curve" list select your flow curve. In the "2nd Curve" list select "Fill to Y reference line" and enter 0.4 in the "Fill to Yref=" box. Use the background color in the "Color" box, and some other color in the "Color Below Yref" box.
The catch is that the background color will be drawn in areas above Y=0.4, obscuring (by default) any grid lines. You can get around this with Options>Symbol Line Styles and selecting "above Fills" under "Grid line placement". That will also draw grid lines below your Y=0.4 line, though.
If instead you want the fill to be drawn below the curve but only for Y values < 0.4, the only way to do that is to make a copy of your curve for each area with Y values < 0.4, and clip all points outside that area, then again use Fill Between Curves for each of those areas.
_________________
Visualize Your Data
support@dplot.com |
|
| Back to top |
|
|
DPlotAdmin
Site Admin
Joined: 24 Jun 2003
Posts: 2310
Location: Vicksburg, Mississippi
|
| Posted: Fri Dec 04, 2009 7:00 pm Post subject: |
|
|
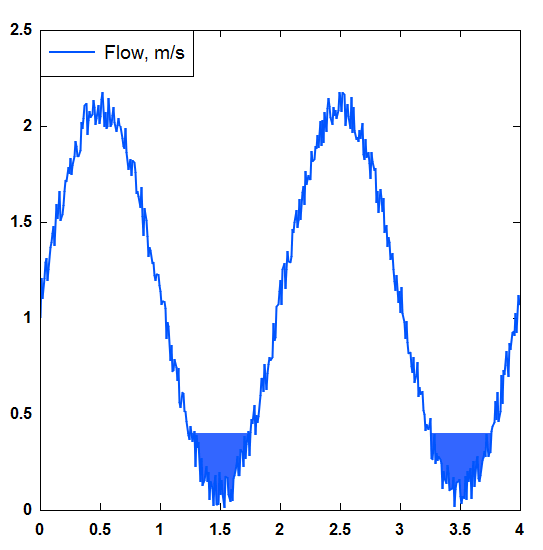
Not sure if this is what you have in mind or not, but I've added an option to the Fill Between Curves command to fill the area below a curve for all points less than or equal to some specified Y:

With any luck an update will be made available sometime this weekend.
_________________
Visualize Your Data
support@dplot.com |
|
| Back to top |
|
|
AlPhuket
Joined: 04 Dec 2009
Posts: 5
|
| Posted: Sat Dec 05, 2009 6:36 am Post subject: Fill area under series depending on "Y" value |
|
|
Thanks David, the second option is exactly what I need. With support like that, I'll be upgrading my trial to a registered version in a few minutes.  |
|
| Back to top |
|
|
DPlotAdmin
Site Admin
Joined: 24 Jun 2003
Posts: 2310
Location: Vicksburg, Mississippi
|
| Posted: Sun Dec 06, 2009 12:16 pm Post subject: |
|
|
Version 2.2.7.6 is now available and includes this change to the "Fill Between Curves" command.
For licensed users, mailing list mail with download instructions is being sent as I write this, or you can get the update using the "Check for Updates" command on the Help menu.
_________________
Visualize Your Data
support@dplot.com |
|
| Back to top |
|
|
|

